The Free 10-Stock Portfolio Beating the Nasdaq
A rules-based model delivering 47% annualized returns vs 23% for the Nasdaq — with minimal rebalancing.
- Only ~10 holdings
- Average hold time: 3+ years
- Wins on 50% of the stocks it buys
- Updates only when stronger stocks emerge
- Built for real performance, not theory
Get the Free Portfolio


"Lutey Value - Warren Buffet - Produced a 9% real time return while Lutey Growth - CAN SLIM - produed a 8.86% real time return from Nov '2025' - Jan '2026' compared to the SP500 return of 3.99%"
Priyanka Ranjan -ex-Goldman Sachs
and Harshit Khandelwal -ex-Amazon professionals Who founded:
PiTrade.com
The portfolios and copy-trading functionality are offered through Pi Trade, an SEC-registered platform founded by former Goldman Sachs and Amazon executives.
My role is focused on developing and publishing the portfolio models, research, and tactical frameworks that power the strategies. Users who choose to follow the models can access them on Pi Trade at discounted pricing, with the ability to copy trade directly through their platform at no additional cost.
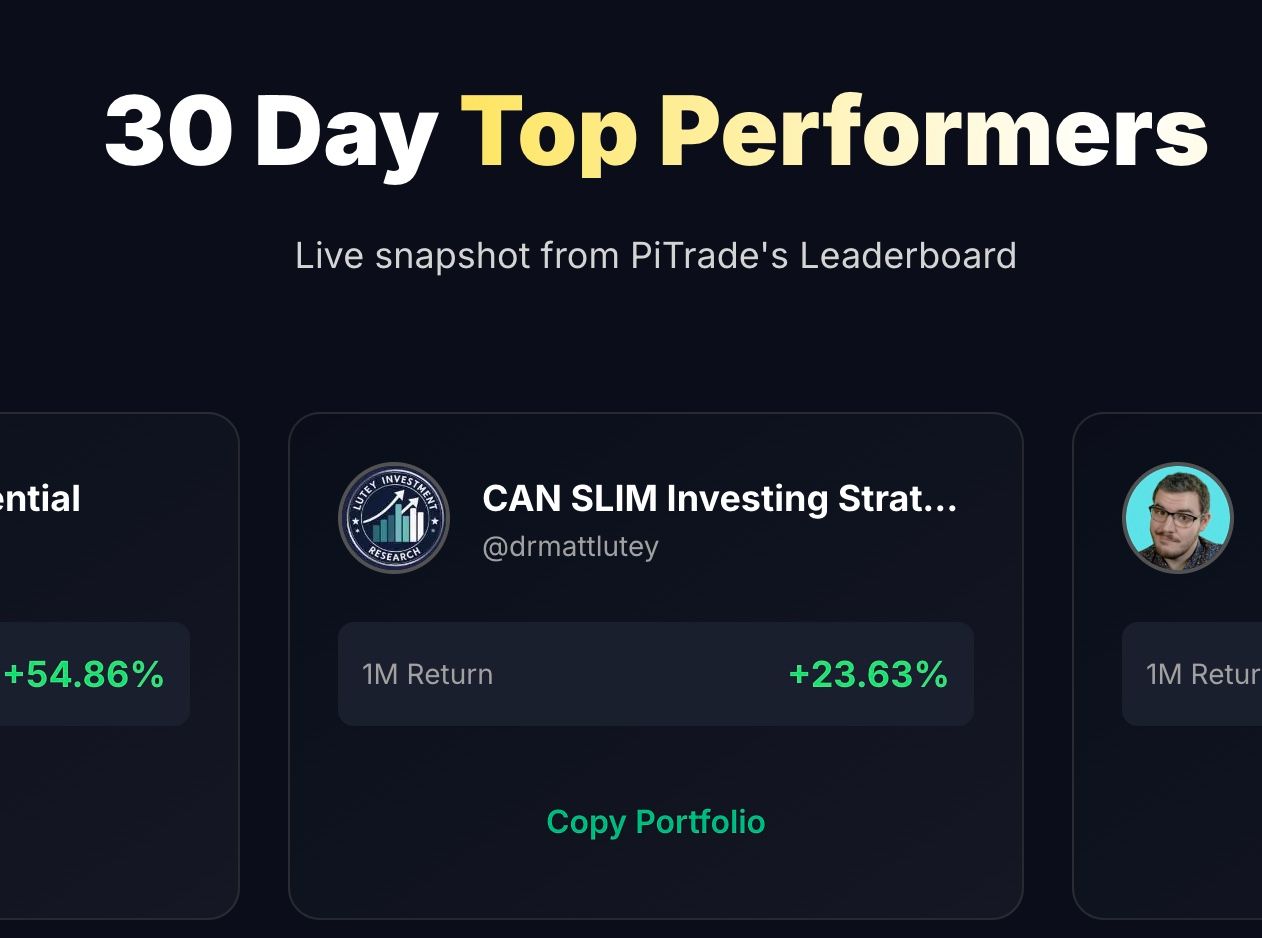
Several of the portfolios have ranked among the top-performing strategies on the platform.
As the partnership grows, Pi Trade has offered a revenue-sharing arrangement tied to platform growth and subscriber adoption. All brokerage execution, account handling, compliance oversight, and regulated investment operations are handled through Pi Trade and its registered infrastructure.
Know When to Be in the Market—and When to Get Out
The Lutey Recession Indicator & Tactical Allocation Signals. A structured system for tracking market risk, timing allocation shifts, and positioning your portfolio ahead of major moves.
-
All future updates on the Lutey Recession Indicator
-
Clear signals for equity vs. debt allocation
-
Tactical shifts based on real market conditions
-
A framework to reduce drawdowns and improve positioning
$25 Get Instant On-Going Access to Market SignalsDesigned to help you avoid major downturns and stay aligned with the market cycle.
Learn Technical Day Trading
Learn to day trade - apply the technical stock picking principles to day trading - use the options delta method to profit from options while managing risk.
Learn from the book on trading. The book covers repeatable set ups from day trading literature + money management principles + psychology rules & risk management techniques using options and profit targets.
Use a specific and repeatable set of rules to trade the market. Apply poker like betting principles to day trading options within a specific time window and specific holding duration.
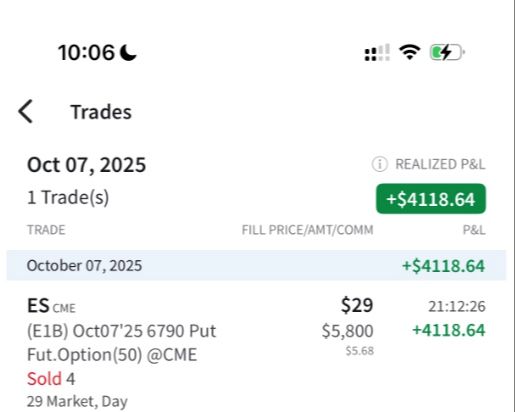
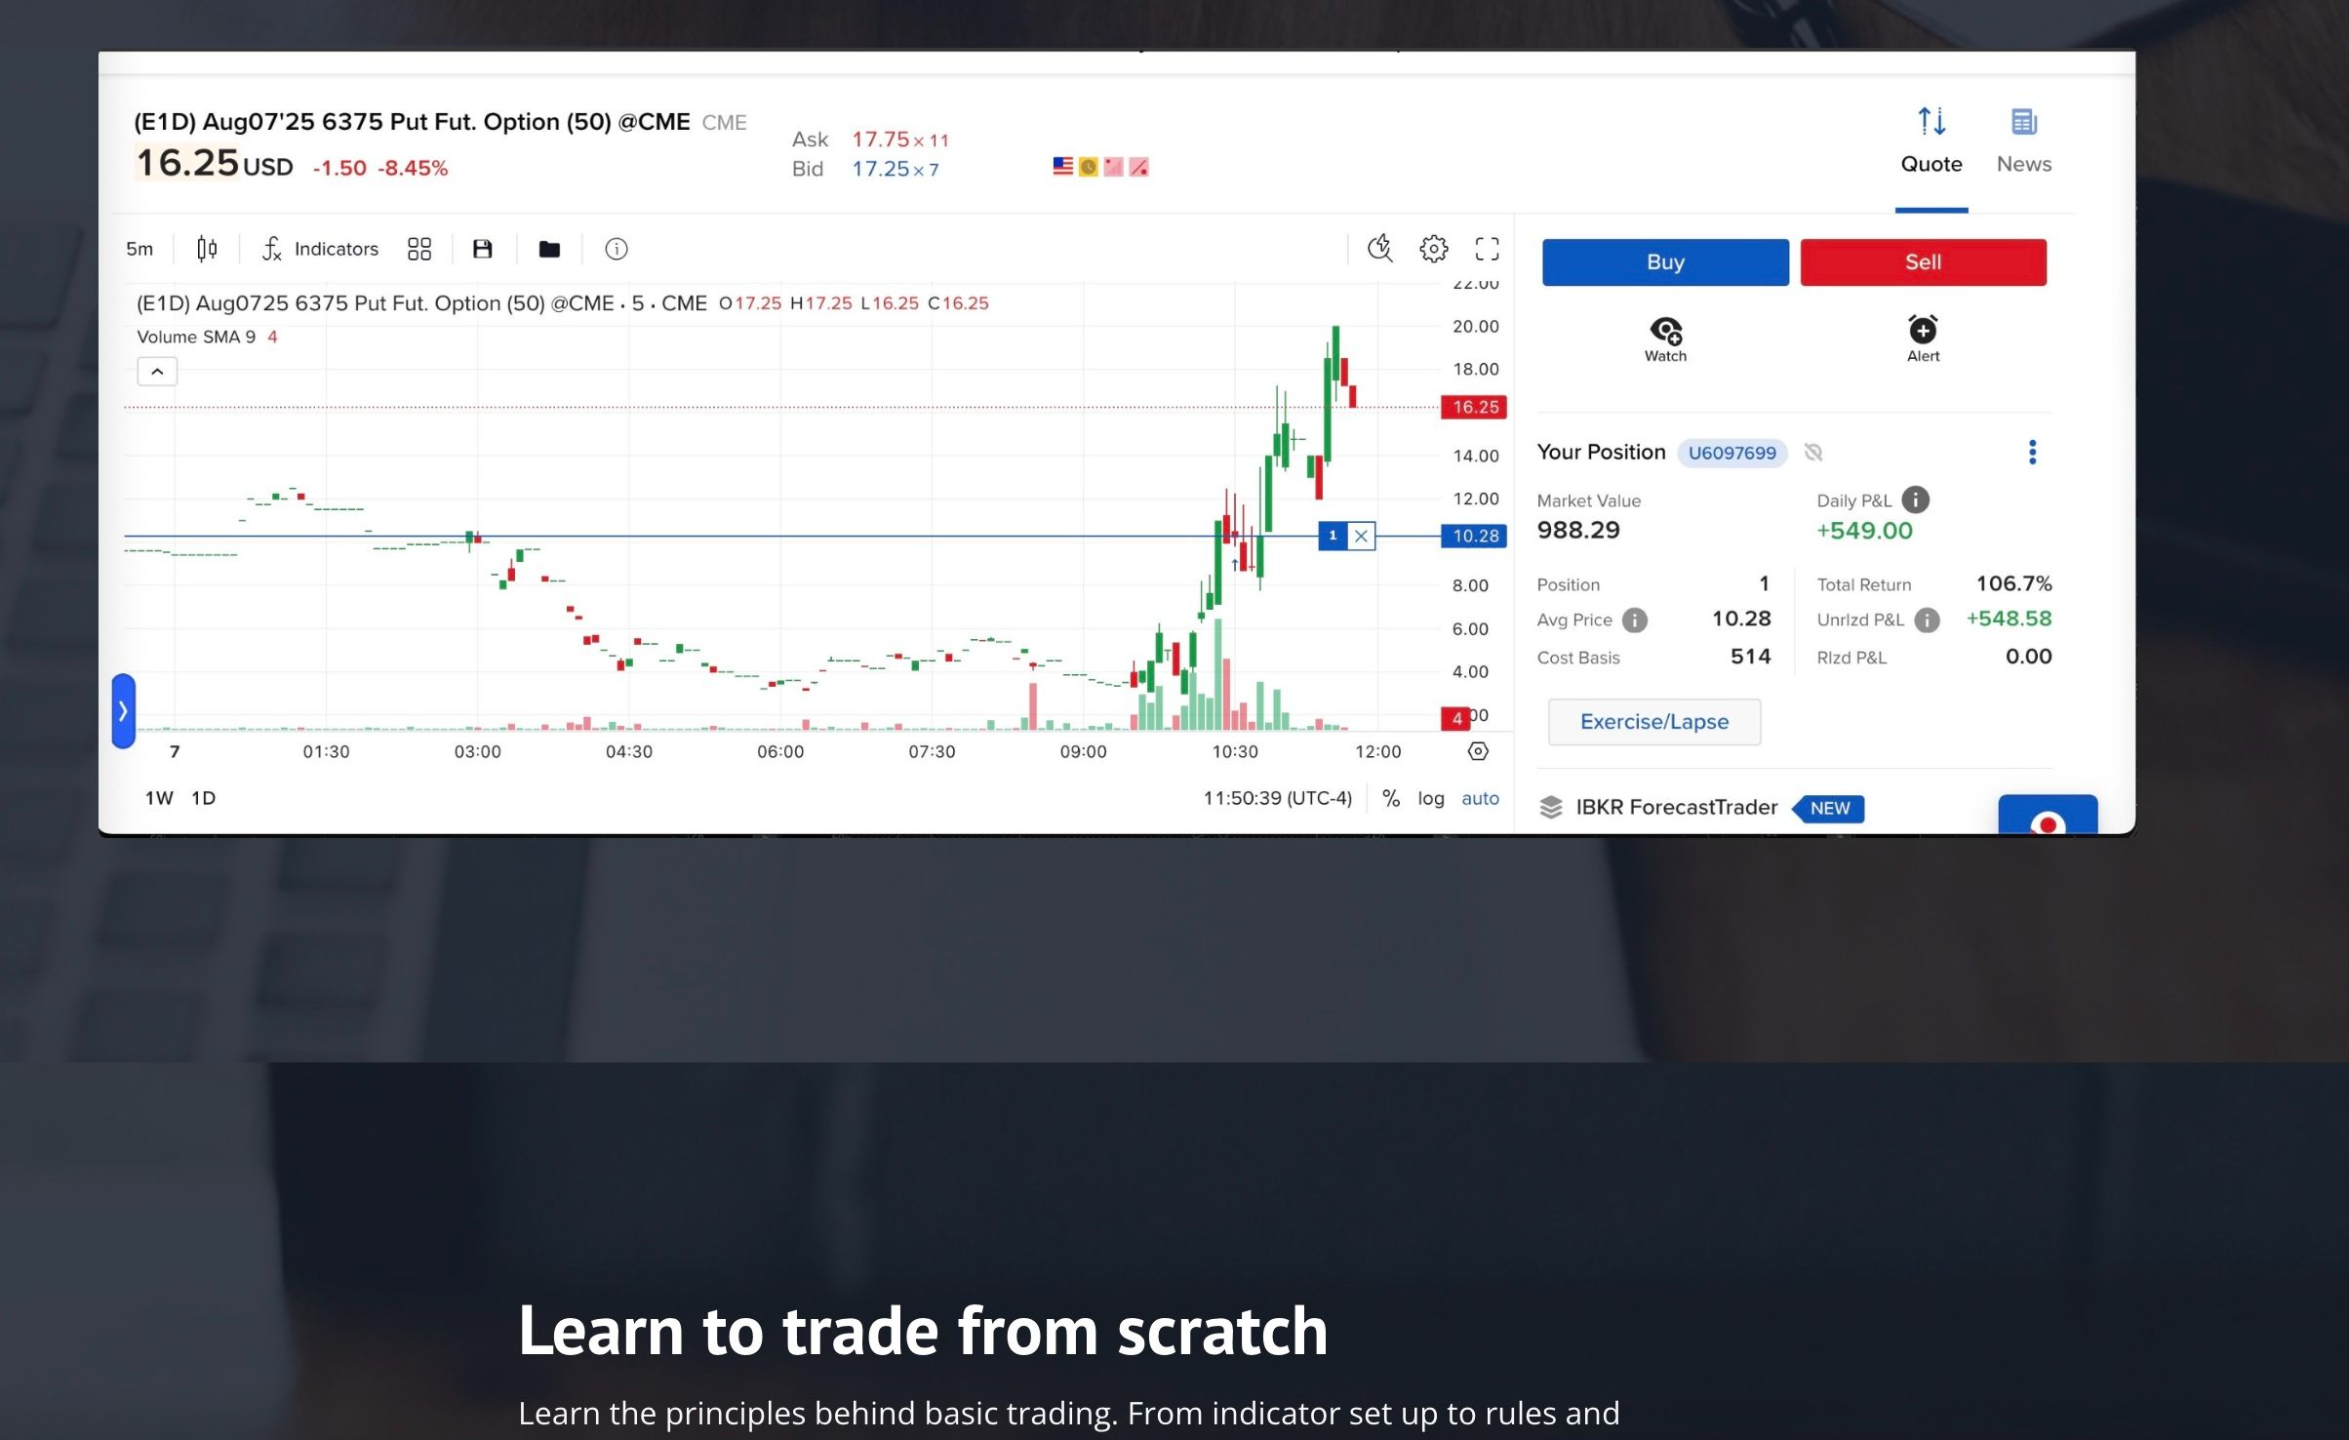
Learn the exact principles I use to hold a $1800 risk options trade for 4 hours and profit $4,000 - from a peak of $7,000 profit. Learn additional set ups that would take a $1,000 bet to $10,000 in a similar or shorter time frame.
Most of the set ups are in the 2 to 1, 3 to 1, 5 to 1 and up to 10 to 1 range. The trade book and examples shown are real trades with real money in real time in a real brokerage account.
Monthly Portfolio Access
A structured system for allocation, signals, and rebalancing
This is for you if you want:
-
A clear equity framework (stock recommended positions - equal weight)
-
Ongoing portfolio updates and signals
-
A structured system to remove guesswork
How It Works
-
Access the members area via web or IOS / Android App.
-
Follow the recommended stock holdings
-
Update every 1-6 months or year
-
Use the system as your core equity structure
- This gives you a repeatable system to manage your portfolio.
Learn to pick stocks inside your portfolio
Learn the exact system I apply intraday - and use it to identify passing (likely to go up or down) stocks in your portfolio!
👉🏻 Teach me to Technical Trade $147 one time - portfolio technical tradingLearn to rebuild the portfolio from scratch - pick stocks inside your portfolio
Learn the exact system I apply to build the monthly portfolios - from reserach and use it to identify passing stocks in your portfolio!
👉🏻 Teach me to Build the Portfolios $279 one time - portfolio technical tradingCase Study: Multi-Model Portfolio with Tactical Risk Overlay
Objective
Evaluate whether combining fundamentally driven stock selection models with a tactical risk overlay can improve risk-adjusted returns relative to the S&P 500.
Framework
This portfolio integrates four independently tested strategies:
- Lutey Growth (CAN SLIM) – momentum + earnings acceleration
- Lutey Moderate Growth (ACS) – balanced growth exposure
- Lutey Value (Buffett) – quality + long-term compounding
- Lutey Value (Graham) – deep value / mean reversion
These models are combined into a single portfolio structure, then enhanced with a:
➡️ Weekly Tactical Capital Weighted Volume (CWV) Overlay
Used to dynamically adjust exposure based on market conditions.
Methodology
- Universe: U.S. equities (NYSE/Nasdaq)
- Timeframe: Backtested (1999–present) + live forward tracking
- Rebalancing:
- Monthly (model updates)
- Weekly (risk overlay adjustments)
- Benchmark: S&P 500 (SPY equivalent)
- Metrics Evaluated:
- Total Return
- Sharpe Ratio
- Maximum Drawdown
- Volatility (Standard Deviation)
Hypothesis
A diversified model framework combined with a tactical overlay should:
- Capture upside from growth and value cycles
- Reduce drawdowns during market stress
- Improve consistency of returns over time
Results (Summary)
(Reference chart below)
- Higher total return vs. S&P 500
- Lower maximum drawdown during major downturns
- Improved Sharpe ratio, indicating better risk-adjusted performance
- Reduced volatility relative to standalone growth models
Key Insight
The edge is not just stock selection—it’s timing exposure.
While individual models perform well independently, the risk overlay acts as a governor, helping to:
- Scale down during weak market conditions
- Reallocate toward strength when trends confirm
- Avoid prolonged drawdowns that erode compounded returns
Why This Matters
Most portfolios fail not due to poor stock selection—but due to poor risk management during regime shifts.
This framework addresses both:
- What to own (multi-model selection)
- When to be exposed (tactical overlay)
Conclusion
Combining systematic stock selection with a rules-based risk overlay produces a more stable, adaptive portfolio capable of outperforming traditional benchmarks across multiple market environments.
Access the Model
Follow the live portfolio and see the current positioning. Self-directed tactical model ($379/month).
$207/mo. Upgrade to the Lutey Tactical S&P 500 System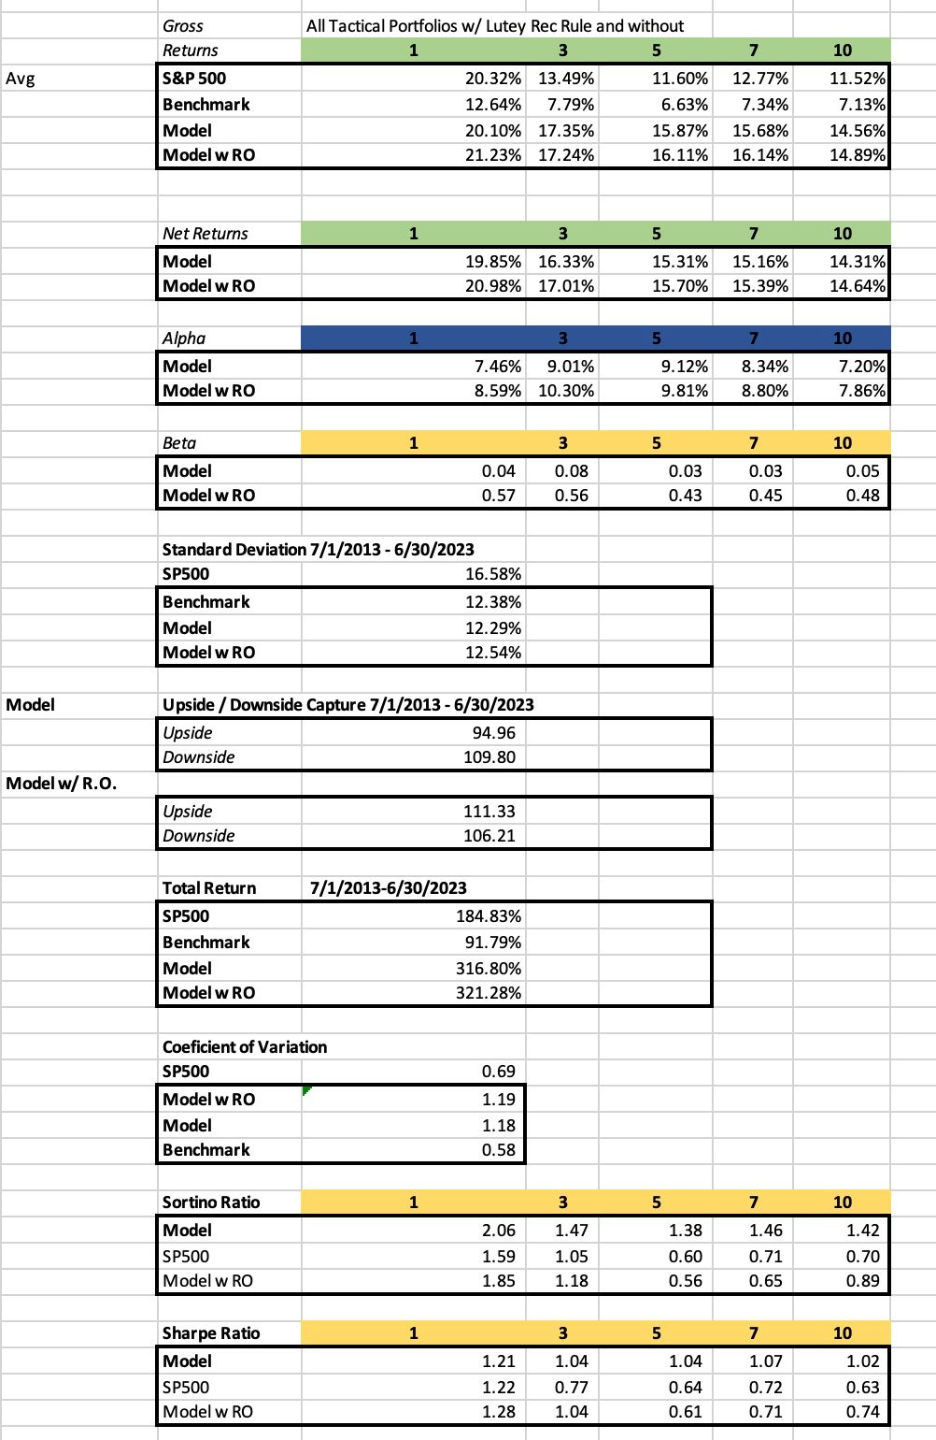
View the self-directed tactical model ($379/month)A Tactical, Rules-Based Portfolio For $100k–$1M Accounts
For investors and advisors looking for a structured, long-term allocation framework.
Follow a disciplined, intermediate-term tactical strategy designed to protect capital, capture trends, and reduce decision fatigue for $100k–$1M+ accounts.
Intermediate-Term Tactical Strategy For Serious Investors (37–65)
Includes access to tactical models, allocation guidance, and ongoing support.
Most clients start with the model and upgrade to advisory once they want deeper alignment.
A Portfolio To Follow, Built For Advisors & Serious DIY Investors
Who it’s for: Portfolio managers & financial planners with $100k–$1M+ per account in AUM, and serious DIY investors age 37–65 with similar account sizes.
What they get: A tactical, rules-based portfolio they can follow to stay invested, sidestep major drawdowns, and compound capital over intermediate time frames without day-trading.Includes access to the three portfolios - CAN SLIM Sp500 - Lutey Growth - Graham SP500 - Lutey Moderate Growth / Value - Buffet - NYSE/AMEX - Lutey Value + Tactical Volume Risk Overlay
Help $100k–$1M+ accounts stay out of deep drawdowns while still participating meaningfully in bull markets.”
Private Clients & Wealth Advisors
- Implementation
- Consulting
- Tactical Systems
Most investors don’t fail because of stock selection
They fail because they don’t have a system for allocation and rebalancing.
What This Actually Does For You
-
Eliminates guesswork from portfolio decisions
-
Defines exact allocation between equity and debt
-
Creates a repeatable system across market cycles
-
Improves risk-adjusted returns vs passive exposure
How People Use This
-
As a core portfolio framework
-
As a benchmark to compare their own strategy
-
As a client-ready allocation system
-
As a base to layer trading or tactical overlays
Apply for Private 1 on 1 Portfolio Coaching - $500 1-hourBuilt using structured portfolios, tactical allocation signals, and disciplined rebalancing rules.
This framework is built on tested portfolio models and real performance across market cycles.
🔥 Watch the Webinar: Build an All-Weather Portfolio
Learn how to combine the Lutey Recession Rule + Tactical Model to balance growth and defense in any market.
$1497 Implementation Coaching!
Learn to apply the portfolios on your ownBuild a Portfolio That Actually Performs - With a Proven Framework
Portfolio Implementation Program (10 Private Sessions)
Stop guessing what to buy, when to allocate, and how to manage risk.
This 10-session program walks you through a complete, structured buildout of your portfolio using the same frameworks used to generate real, out-of-sample performance.
→ From scattered ideas → to a fully defined investment system
What You Get
- 10 private 1-on-1 sessions (normally $500 each)
- Step-by-step portfolio buildout
- Integration of value, growth, and tactical models
- Clear allocation + macro framework
- Trade selection + execution rules
- Risk management using the Lutey Recession Indicator
- Ongoing optimization and scaling plan
Designed For
- Investors with $100K–$1M+ portfolios
- Those tired of reacting to the market
- Professionals who want a repeatable system
Investment
$4,497
(A structured program designed to replace years of trial and error)
👉 Apply now / Get Started (10 call package $4,497)Technical Analysis - Intermediate
CAN SLIM Investing Model: Learn the intermediate technical tools for intermediate time frame investing.
Learn about Dr. Lutey Research LLC
Learn MoreLearn to direct Your own Portfolio
Mimic my process to achieve backtested and live out of sample + out performance!
Mimic the exact system used to generate backtested and real results.
$15,997 — AI Portfolio Mastery
Build a Portfolio That Adapts to the Market—Automatically
Learn how to integrate Artificial Intelligence into your investment process and create a system that evolves with changing market conditions.
From static portfolios → to intelligent systems.
Program Name Ideas
Dr. Lutey Quant Portfolio Systems Lab
Build Your Own Technical Pattern + Macro Portfolio Engine
Advanced Portfolio Research Implementation Program
Core Positioning
This $14,997 program teaches investors, researchers, advisors, and advanced students how to move beyond simply reading strategy papers and instead build, test, and operate their own portfolio research system.
The program combines:
- Technical chart pattern database construction
- R-based pattern testing
- Mathematica dissertation model implementation
- Macro regime classification
- Red / Yellow / Green market state logic
- Automated stock selection from passing strategies
- CAN SLIM, Graham, and Buffett-style portfolio screens
Checkout / Sales Page Copy
Advanced Portfolio Systems Implementation Program
Build Your Own Pattern Database, Macro Regime Model, and Automated Stock Selection Engine
This private implementation program is designed for serious investors, researchers, advisors, and advanced students who want to learn how to build a complete portfolio research system from the ground up.
Instead of simply following a model portfolio, you will learn how the research process works behind the scenes.
We will walk through how to use large financial datasets, such as CRSP-style stock return databases, to identify and test technical chart patterns across thousands of securities. You will learn how to run an R-based technical chart pattern program, organize the output into a usable pattern database, and understand how those results can be connected to portfolio selection rules.
The program also includes a walkthrough of the Mathematica-based framework originally developed through my dissertation research. This gives you a deeper look at how academic-style financial modeling can be translated into practical investment systems.
From there, we begin building the foundation of the full $15,000 system: understanding the macro environment.
You will learn how to organize macro inputs, evaluate whether the market environment is favorable or defensive, and classify the economy into a simple Red / Yellow / Green state. That regime state can then be used as a filter for deciding whether to be aggressive, cautious, or defensive with portfolio exposure.
Once the macro state is identified, the system then connects to strategy-based stock selection models, including:
CAN SLIM / Lutey Growth
Benjamin Graham / Lutey Hybrid Value
Warren Buffett / Lutey Value
Technical chart pattern screens
Macro-regime portfolio overlays
The goal is to help you understand how to build a repeatable research and portfolio process that can identify passing stocks, organize them by strategy type, and create a disciplined framework for portfolio construction.
What You Learn
You will learn how to:
Run the R program for technical chart pattern identification.
Use large stock databases to build a historical pattern library.
Understand how chart patterns can be tested across broad equity universes.
Work through the Mathematica framework from dissertation-level research.
Connect technical signals to portfolio selection rules.
Build a macro input dashboard.
Classify the market into Red, Yellow, or Green regimes.
Use macro conditions to determine whether portfolio exposure should be aggressive, moderate, or defensive.
Pull passing stocks from strategy screens such as CAN SLIM, Graham, and Buffett-style models.
Connect academic research, technical analysis, and portfolio implementation into one system.
Program Structure
Phase 1 — Technical Pattern Database
We begin with the R-based technical chart pattern program. You will learn how the data is structured, how the pattern logic is applied, and how the output can be organized into a usable research database.
Phase 2 — Mathematica Dissertation Framework
Next, we walk through the Mathematica program developed from my dissertation research. The focus is on understanding how deeper academic modeling can be translated into practical testing and portfolio construction.
Phase 3 — Macro Regime System
Then we build the beginning of the macro regime model. We identify the key input variables, organize them into a usable framework, and classify the market into a Red, Yellow, or Green state.
Phase 4 — Strategy Stock Selection
Once the market state is identified, we connect the regime framework to stock selection. This includes pulling passing stocks from CAN SLIM, Graham, Buffett, and other strategy-based models.
Phase 5 — Portfolio System Design
Finally, we combine the technical pattern database, macro model, and strategy screens into a repeatable research workflow that can be updated over time.
Investment
Advanced Private Implementation Program
$14,997
This is not a basic investing course. This is a private implementation program for people who want to understand how to build the research infrastructure behind technical, fundamental, and macro-driven portfolio systems.
Call to Action (CTA)
Enroll in the Advanced Portfolio Systems Implementation Program and learn how to build your own technical pattern database, macro regime model, and automated stock selection framework.
[Enroll Now] [Get Info]