How to use the Lutey Recession Indicator
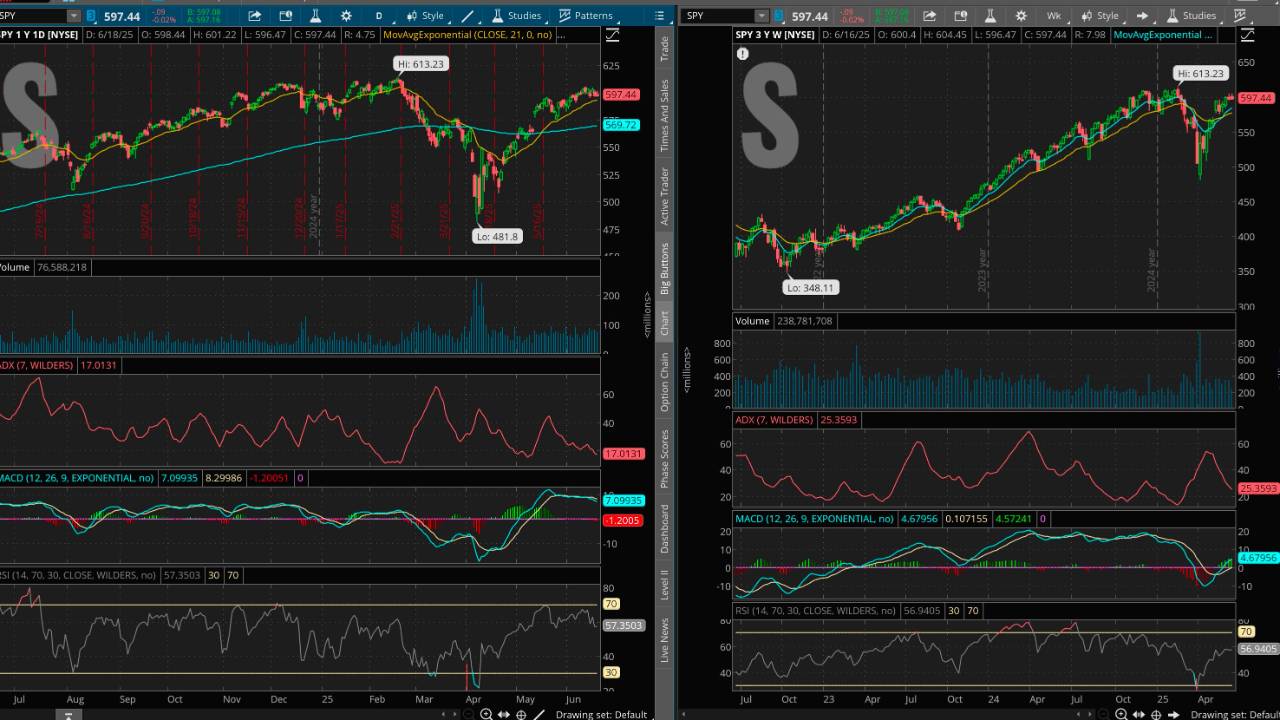
The recession indicator is based on the moving average death cross signal when the 21 day period moving average crosses below the 200 day moving average on the SP500. This indicator incorporates financial fundamental information that professional analysts and large firms use that has already been incorporated into the stock price.
It picks up on the buying and selling behavior of the stock and measures not only the sentiment but the supply and demand of shares of large institutional investors and all individual market participants. By itself, it will tell you when in the short-term prices are likely to continue falling. Combined with the yield curve (term structure of interest rates) it can lead to a powerful recession indicator.
The indicator works by not only just telling you when to exit the market but when to get back in by combining both fundamental and technical information. The yield curve study by itself does not provide much benefit.
To learn how to build the recession indicator on your own please subscribe to the 'interemediate' version of the model.