
How to use the Lutey Recession Indicator:
The recession indicator is based on the moving average death cross signal when the 21 day period moving average crosses below the 200 day moving average on the SP500. This indicator incorporates financial fundamental information that professional analysts and large firms use that has already been incorporated into the stock price.
It picks up on the buying and selling behavior of the stock and measures not only the sentiment but the supply and demand of shares of large institutional investors and all individual market participants. By itself, it will tell you when in the short-term prices are likely to continue falling. Combined with the yield curve (term structure of interest rates) it can lead to a powerful recession indicator.
The indicator works by not only just telling you when to exit the market but when to get back in by combining both fundamental and technical information. The yield curve study by itself does not provide much benefit.
How the Indicator Is Used
The Lutey Recession Indicator is not a trading signal, but a risk-regime filter:
Risk-OFF regime
Indicator inactive
Growth, momentum, and fully invested equity strategies favored
Risk-ON / Defensive regime
Indicator active
Shift toward:
Cash or short-duration assets
Defensive sectors
Reduced exposure or hedged portfolios
This makes the LRI especially well-suited as an overlay on:
CAN SLIM–style growth portfolios
Factor or sector-rotation strategies
Tactical asset-allocation models
Follow the Allocation Guide
Learn the current recommended allocation + stay up to date on all future updates.
Follow the Lutey Recession Allocation ($25 one time)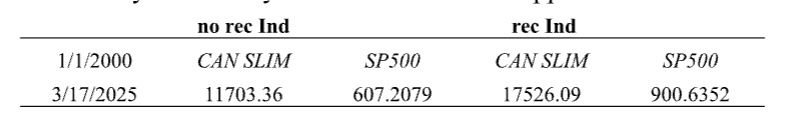
A case study: Application of the Lutey Recession Rule
The Lutey Recession Rule was applied ex-post to both the CAN SLIM portfolio and the overall Market (SP500). The filter rule exits the market following the real time signal generated by the indicator and re-enters the market upon meeting the market re-entry criteria.
The results show that both the CAN SLIM portfolio and SP500 alone improve by nearly 50% by applying the rule during the recession period. This application suggests a 'defensive' approach and switching from an aggressive 80% equity 20% bond exposure to a 60% equity 40% bond exposure following the rule.
Lutey Recession Rule - How to switch between aggressive and defensive strategies
How do you determine when to allocate between growth and defensive strategies?
The blended allocation between equities and bonds can provide a consistent return for your portfolio - regardless of market conditions - as long as stocks and bonds don't move down together. Bonds historically provide a consistent rate of return while the market is selling off during a recession. Making it a more ideal portfolio allocation than 100% equities. How do you know when to shift to this more defensive allocation?
The video below describes the U.S. Yield Curve - a Macro Indicator that has historically lead to the selloff of each of the previous recessions in the last 25 years (2019 - Covid-19, 2008 - U.S. Recession). How can it be used along with the passing stocks of a portfolio like Lutey Growth - 'CAN SLIM'?

Rules to Re-Enter the market
Lutey Recession Indicator will only re-enter the market when:
- The MA crossover has ended,
- No yield curves are inverted from the 272 day offset prior to the MA cross,
- And no new inversions have occurred while the signal was active
At that point, stop monitoring for signals the recession risk has likely passed.
Why the Advanced Course is the Next Step
The intermediate course is great for understanding the core signals and applying them to a broader investment strategy. But for hedge funds and professional investors, the stakes are higher, and the margin for error is razor-thin. The advanced course is designed to give you deeper insights, more precision, and exclusive tools that go beyond the basics. It’s about turning good decisions into great ones and consistently staying ahead of the curve.
What the Advanced Course Provides
Here’s what makes the advanced course a game-changer for professionals:
1. Real-Time Data Integration
- While the intermediate course relies on quarterly updates and broader signals, the advanced course integrates real-time data feeds.
- You’ll get access to live yield curve updates, moving average crossovers, and other critical indicators as they happen.
- This allows you to act immediately, rather than waiting for the next update cycle.
2. Customizable Decision Rules
- The advanced course includes tools to customize the Lutey Recession Indicator based on your specific investment strategy.
- For example, you can adjust thresholds for moving averages or tailor the yield curve analysis to focus on sectors or asset classes most relevant to your portfolio.
- This level of customization ensures the Indicator aligns perfectly with your unique goals.
3. Sector-Specific Insights
- Dive deeper into how recession signals impact specific sectors like tech, energy, or financials.
- The course provides sector-by-sector breakdowns, helping you identify which areas are most vulnerable or most likely to thrive during different phases of the economic cycle.
4. Advanced Hedging Strategies
- Learn how to use the Indicator to implement sophisticated hedging techniques, such as options strategies, inverse ETFs, or sector rotation.
- This isn’t just about avoiding losses it’s about finding ways to profit even in downturns.
5. Exclusive Access to Expert Analysis
- The advanced course includes monthly live Q&A sessions with me (or a similarly qualified expert), where we’ll break down the latest market trends and answer your specific questions.
- You’ll also get access to a private community of hedge fund managers and professional investors, creating opportunities for collaboration and idea-sharing.
6. Historical Backtesting Tools
- Gain access to a proprietary backtesting platform that allows you to see how the Indicator would have performed in past market cycles.
- This helps you refine your strategy and build confidence in the system’s reliability.
7. Macro-Level Economic Models
- Go beyond the Indicator with advanced training on interpreting macroeconomic data, such as GDP growth, unemployment rates, and global monetary policy.
- This gives you a broader context for understanding how the Indicator fits into the bigger picture.
A real time sector regime switching model
A recent publication in the Journal of Portfolio Management discusses the automatic switching between market conditions following the macro-economic outlook (interest rates, announcements, etc.) and the sector allocation of the Lutey Growth 'CAN SLIM', Lutey Moderate Growth 'Simplified CAN SLIM', Lutey Value 'Warren Buffet' portfolios along with the Lutey Growth 'Benjamin Graham' model. This model proposed considers an 'all weather' portfolio exposed to the individual styles of both growth and value while tactically allocating between stocks and bonds.
A 80%/20% allocation may be used during expansionary growth periods. These are periods where the Lutey Recession Indicator has returned to normal. A 70%/30% allocation rule may be used when the market is trending up on declining volume, is in a late-stage bull market rally, and the prior yield curve inversion has triggered the baseline condition needed for the Lutey Recession Rule to be active - following a 'death cross' signal. A 60%/40% allocation rule may be used after the 'death cross' signal and confirming the length of the prior interest rate inversion meets the condition for the Lutey Recession Rule to be active.
Work with me to learn more about optimal allocation between stocks and bonds following the Lutey Recession Indicator. Work with me to understand better which stocks to hold in a portfolio and how to combine the properties of both growth and value in an 'All Weather' Portfolio.

Free Regime Switching Cheat Sheet + Allocation Ladder
Flip from Risk OFF → Risk ON before crashes hit. Get the 3 signals, regime ladder, and sector rules that dodged 20%+ drawdowns.
Send me the Free GuideReady to Build Your All-Weather Portfolio?
Pick your strategy session:
15 min – (Initial Contact)
60 min – (Full roadmap)
We'll map your Lutey model mix and tactical overlays. What's your top risk/return priority?
Build a Portfolio | Book a Strategy Session