Modern Media
Modern Media
Blog About Contact Portfolio Consulting
Log In

Lutey Recession Indicator Applied to March 2025

Jun 19, 2025
Connect

Yield Curve Inversion + MA Crossover

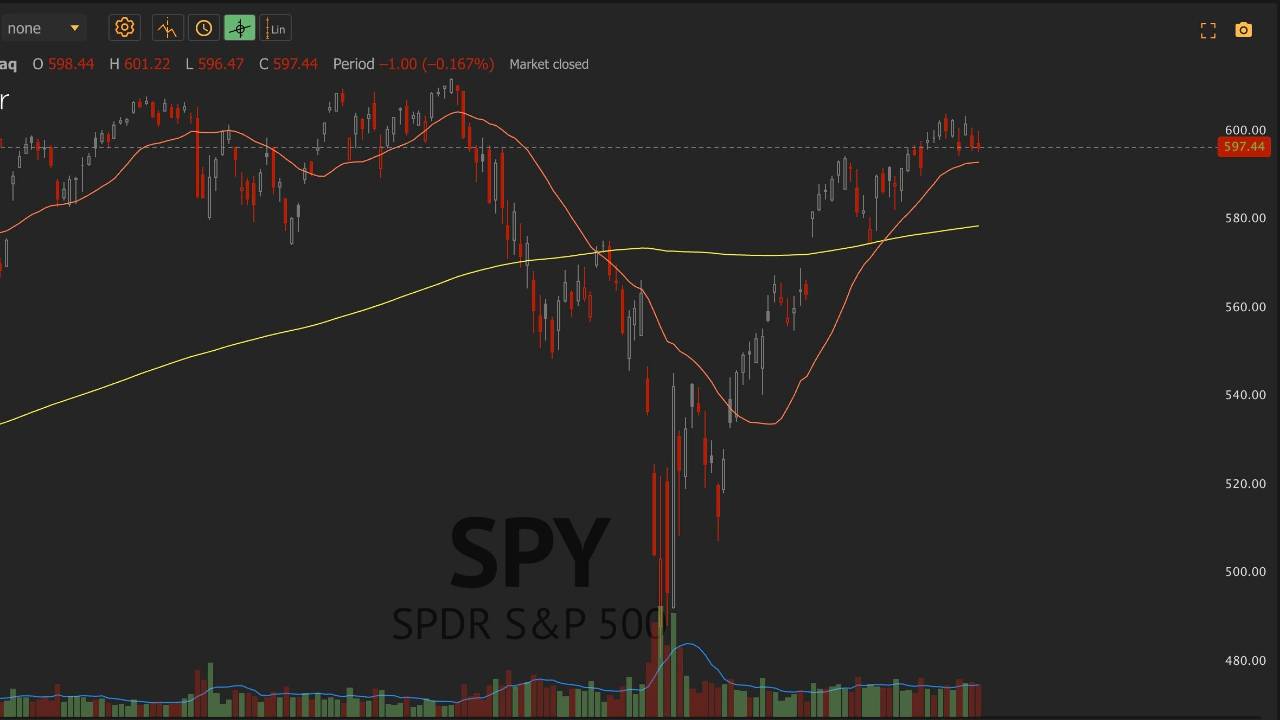
SP 500 observed a moving average (MA) crossover of 21 day and 200 day moving averages on the daily index around March 25, 2025. Prior to this, interest rates were inverted for most of 2023 and 2024.

In this case, the relevant inversion period (272 days before MA crossover) begins on March 4, 2024. You would remain out of the market for the entire duration of that inversion and continue to stay out if the MA crossover is still active or if new rate inversions occur.

The rate inversion began on March 4, 2024, and persisted until December 2024. Since then, the yield curves have been intermittently inverting. This means you should monitor both the 1-year/5-year and 1-year/10-year yield curve inversions, along with any new ones that may arise.

The rates resumed to normal for 49 days starting 12/13/2024. So monitor the market for the length of the moving average crossover or a second moving average crossover if the moving average resumes to normal. 

The rule is as follows: when rates are inverted for 3 consecutive months look for a moving average crossover. Then stay out of the market for as long as either (1) the MA crossover remains valid, or (2) rates were inverted starting from 272 days before the crossover.

The current state would be to stay out of the market following the moving average crossover signal or 197 days starting when the moving average crossed over.

Lutey Recession Indicator will monitor the state of the market and post an update after the 197 day consecutive rate inversion period is over and follow either any new moving average crossovers that have occured then or new rate inversion periods until no rates are inverted or moving averages are crossed over. 

Understanding Recession Timing Signals: A Beginner's Guide
Hello there, financial enthusiasts! This week, we're diving into the world of recessions. Don't worry, we're not predicting one, but it's always good to understand the signals that could indicate one is on the horizon. Let's unravel the mystery together! What is a Recession? A recession is a period of temporary economic decline, typically identified by a fall in GDP in two successive quarters. ...
Mastering Moving Average Overlays: Essential Tips for Forward-Thinking Investors
Hello Forward-Thinking Investors! Welcome to this week's newsletter where we'll be diving into the world of Moving Average Overlays. This powerful tool can help you make informed decisions and maximize your investment returns. So, let's get started and master this essential skill together! Understanding Moving Average Overlays Moving Average Overlays are a type of technical analysis tool used t...
Maximizing Your Investment Strategy with TrendSpider Tools
Hello TrendSpider community! Welcome to this week's newsletter where we'll dive into how you can maximize your investment strategy using our powerful tools. Get ready to unlock new levels of understanding and potential in your financial journey. Understanding TrendSpider Tools TrendSpider tools are designed to make market analysis more efficient. Our automated technical analysis software can he...

Turn Uncertainty Into Strategy.

Get recession timing signals, moving average overlays, and TrendSpider tools designed for forward-thinking investors.
RESOURCES
Contact
SERVICES
My Products
ABOUT
Customer Log In
© 2026 Dr Lutey Research | Terms of Use | Privacy Policy

Work with me

Build a portfolio or engage in a coaching strategy session.