The Story Behind My Equity Curve: Growth, Volatility, and Control
May 05, 2026Here’s a clean break down for you of the equity curve:
The Story Behind My Equity Curve: Growth, Volatility, and Control
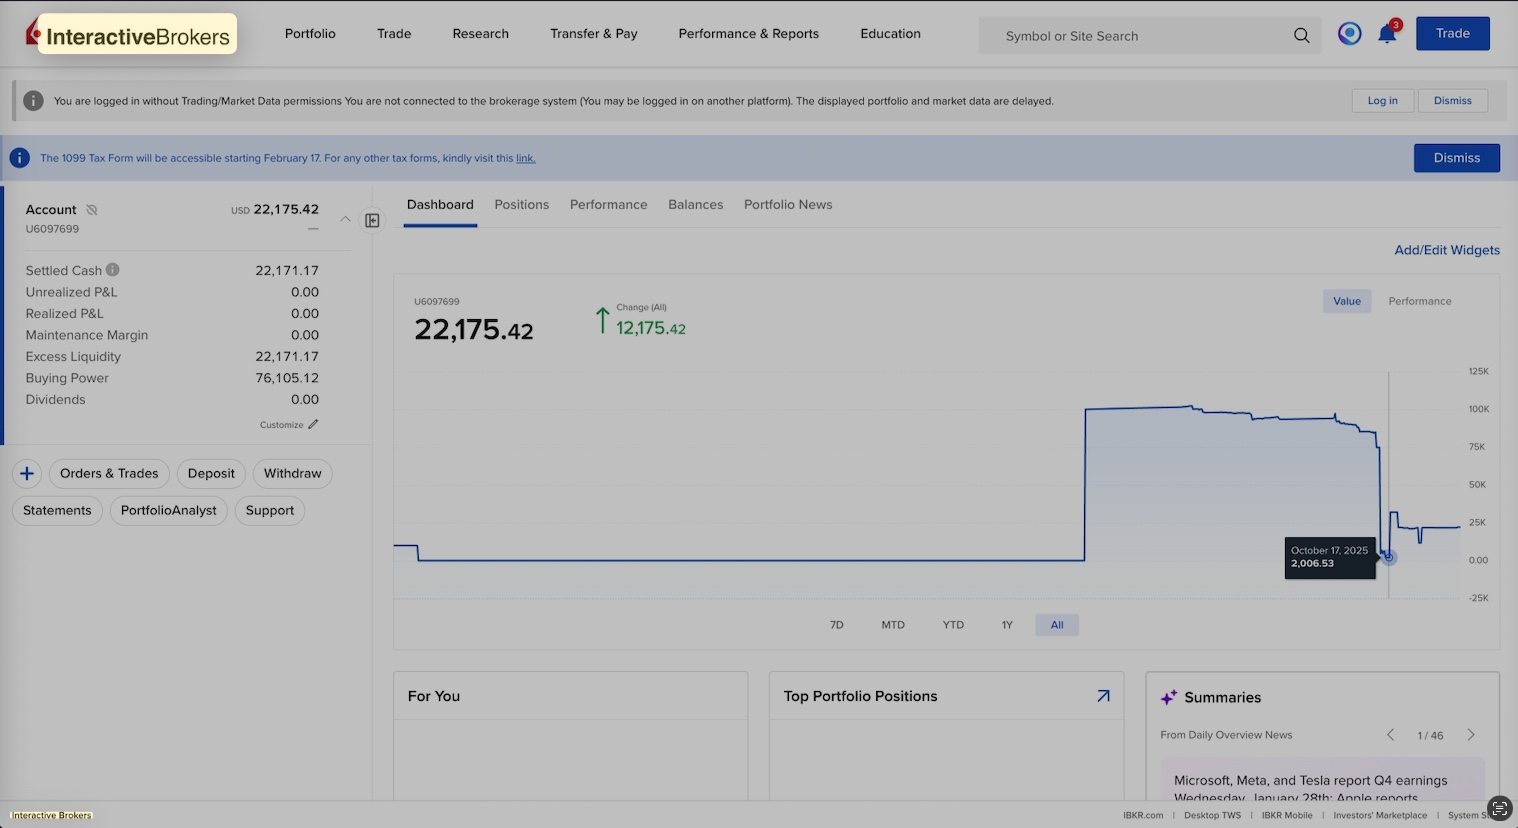
One of the most honest representations of any trading system isn’t a single trade—it’s the equity curve over time.
Looking at my Interactive Brokers account, the curve tells a very real story of progression, risk, adaptation, and ultimately stabilization.
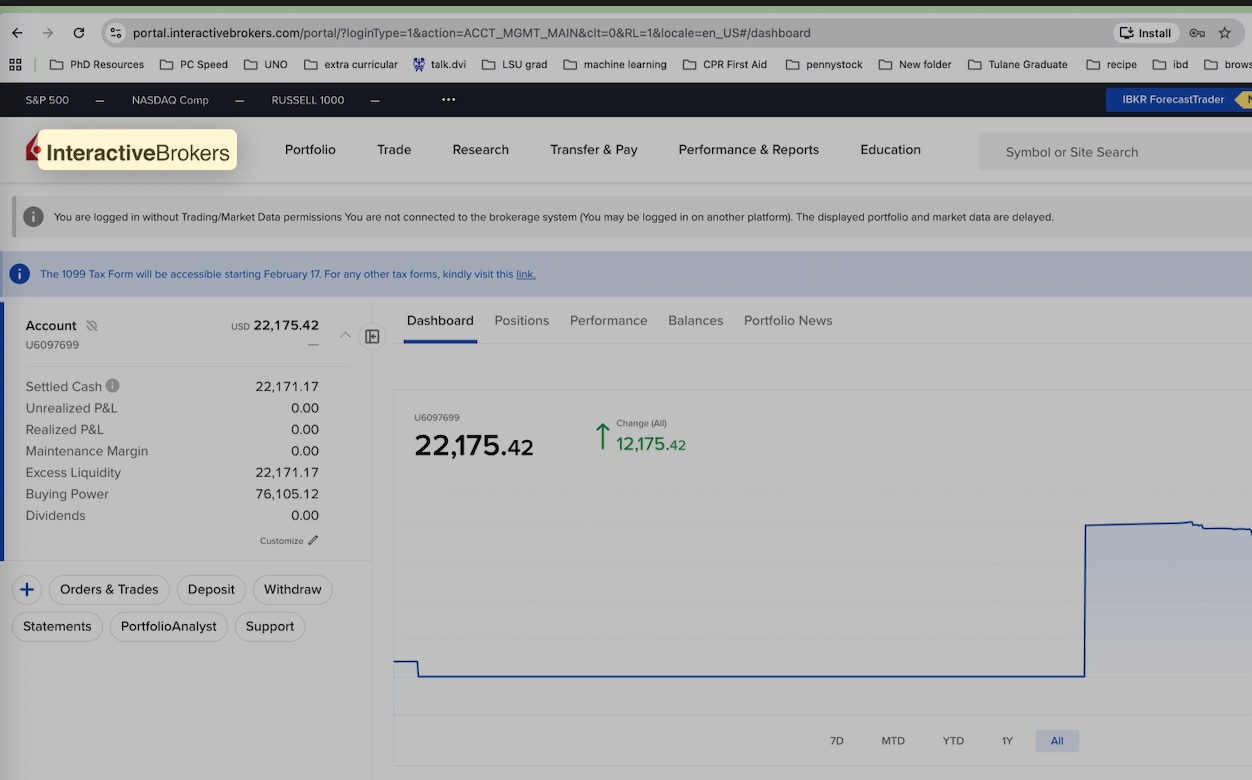
Phase 1: Flat → Controlled Start
The early portion of the curve is relatively flat. This isn’t inactivity—it’s intentional restraint.
During this phase, the focus was:
-
Testing setups
-
Refining execution
-
Preserving capital
Most traders overlook this stage, but this is where edge is built. No unnecessary trades, no forcing action—just observation and preparation.
Phase 2: Rapid Expansion
The sharp vertical move in the curve represents a period of aggressive capital growth.
This is where:
-
High-conviction setups aligned
-
Risk-to-reward profiles were optimal (2:1 to 4:1+)
-
Execution was decisive
These types of moves don’t come from randomness—they come from waiting, then pressing when the edge is clear.
However, this phase also introduces a critical challenge: managing success.
Phase 3: Drawdown and Volatility
After the peak, the curve shows a meaningful pullback.
This is the part most people avoid talking about—but it’s where real traders are defined.
What likely contributed here:
-
Scaling position size too quickly
-
Market conditions shifting
-
Slight deviations from strict rules
-
Overtrading after a strong run
This is not failure—it’s feedback.
Every drawdown is data. It highlights where discipline needs tightening and where the system must adapt.
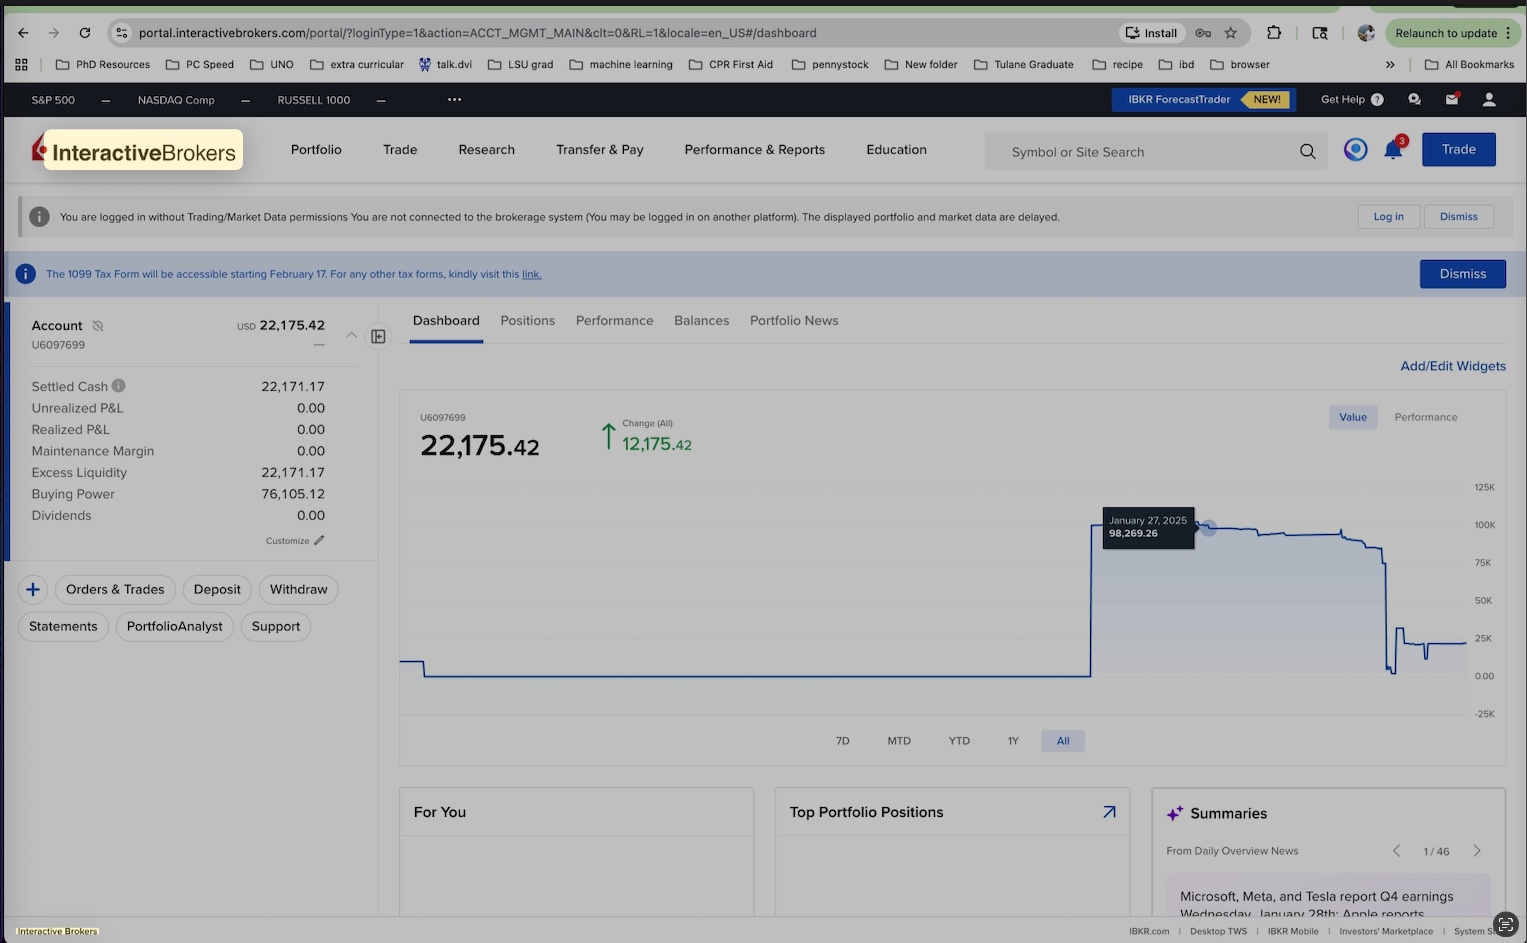
Phase 4: Stabilization and Reset
The most recent portion of the curve shows stabilization around ~$22K.
This is arguably the most important phase:
-
Risk is controlled again
-
Position sizing is more disciplined
-
Focus returns to repeatable setups
-
Emotional volatility is reduced
Instead of chasing the previous peak, the goal becomes:
consistent, repeatable gains with minimal drawdown
Key Takeaways
-
Equity curves are never linear
Growth comes in waves—flat periods, expansions, and contractions. -
Big gains require patience, not constant action
The largest move came after a long period of waiting. -
Drawdowns are part of the system, not a flaw
They refine strategy and reinforce discipline. -
Longevity > short-term spikes
The goal is not a single vertical move—it’s building a curve that compounds over time. 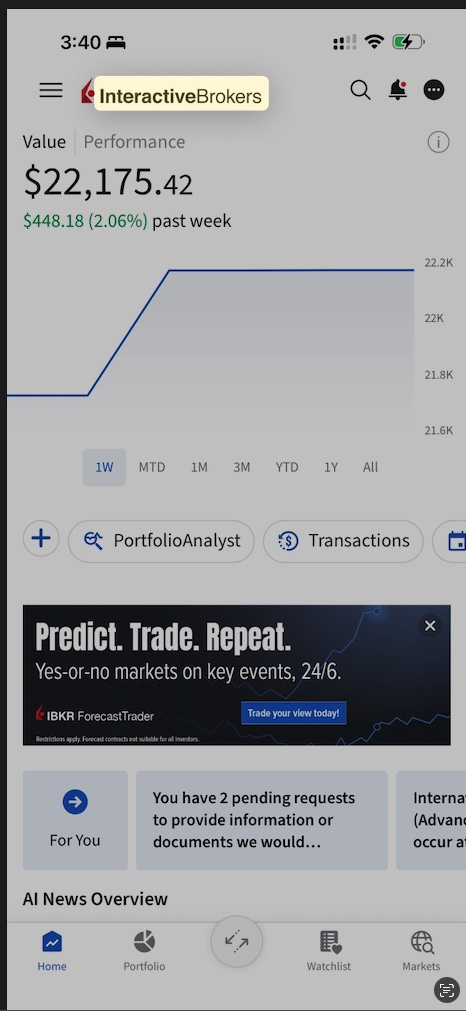
Final Thought
Anyone can show a winning trade.
Very few can show the full equity curve—the highs, the pullbacks, and the rebuild.
That’s where the real edge is built.
You can view my book on trading here: view the book.
checkout - buy the book - direct checkout ($45)