
The Hidden Signals in Bitcoin Futures and S&P 500 RSI You Can’t Afford to Ignore
Jul 19, 2025I'm analyzing the daily charts for the S&P 500 ETF (SPY) and the Bitcoin Futures Contract (/BTC), and there’s a clear theme emerging: both markets appear overbought and are showing signs of potential turnover.
For the S&P 500, the key signal I’m focusing on is a traditional price breakdown, supported by the Relative Strength Index (RSI). The RSI is displaying a textbook breakdown pattern, which aligns with classic technical analysis principles. (The accompanying image is sourced from the Chartered Market Technician (CMT) Level 2 material.)

See the chart below:

This classic RSI pattern, combined with its presence on the Daily chart, signals a significant price breakdown. The Lutey Recession Indicator suggests staying out until October, though it’s not a standalone rule. During the Covid-19 selloff, we saw a similar V-shaped recovery despite consistent interest rate inversions and a death cross of the 21- and 200-day moving averages on the Daily S&P 500. Yet, the market continued upward, with the indicator signaling re-entry by June. Check out the chart below for a closer look.

Looking at the RSI (bottom graphic below volume), we see a clear story unfold. The RSI oversold signal in blue shows a classic buy pattern following indecision, with no significant divergence until April through July 2021. By October 2022, a textbook head-and-shoulders pattern emerged, signaling the market was topping out. This led to a selloff and the eventual death cross on the Daily S&P 500, though it wasn’t preceded by a prolonged interest rate inversion.
Fast forward, two bullish divergence signals on the RSI in early and late 2022 (both in blue) marked a market rally. The V-shaped recovery during Covid-19, while sharp, wasn’t fueled by a long period of inversion either. Missing the June rally was a small price to pay for those who recognized the RSI buy signal and re-entered strategically.
The last bearish divergence in April and July 2024 (in red) followed a failed price breakdown in late 2023 to early 2024. This led to a brief selloff, but the RSI’s inability to sustain highs by late 2024, combined with the March 2025 death cross on the 21- and 200-day moving averages, triggered a more significant selloff and subsequent V-shaped recovery.
While the RSI buy signal during Covid-19 aligns with recent recovery patterns, the prolonged yield curve inversion this time around has the Lutey Recession Indicator advising caution, suggesting participants stay out until mid-October. This highlights the importance of balancing technical signals with broader economic context. Intermediate-term signals, like the Accumulation/Distribution rating from Investors.com (based on Larry Williams' indicator), currently suggest that investors are fully invested in the S&P 500. This reflects strong institutional buying, but it’s always wise to balance such signals with broader market context and technical indicators.

I think this is also mirrored with a similar reading on the Capital Weighted Volume Indicator (CWV) - using Portfolio123.com to implement this indicator and running it on the Famous Investor Model 'CAN SLIM' portfolio (investors.com specializes in the CAN SLIM system).

We can observe that the indicator signaled an early exit in January, followed by a recovery in May, aligning with the market's rebound. However, the prolonged yield curve inversion leading up to the Death Cross signal adds weight to the cautionary narrative, emphasizing the need for strategic patience.

As an investor, you really have to weigh your comfort level with the strategies you’re using and the actions you’re willing to take. On a foundational level, staying fully invested in low-cost mutual funds and consistently reinvesting is a tried-and-true method for retirement savings. It’s simple, it’s passive, and it works over the long haul. But if you’re looking for something more dynamic, a strategy like CAN SLIM—where you’re holding 10-15 stocks and rebalancing every few months—can offer stronger returns for those willing to put in the effort. Then there’s the more active approach, like using something like the Lutey Recession Indicator, which helps you step out during those recessionary periods that tend to pop up every 5-10 years, often tied to interest rate inversions and moving average crossovers. That can be a game-changer for protecting your portfolio and maximizing gains.
But here’s the tradeoff—recession indicators can sometimes mean missing out on some upside, and that’s exactly the challenge we’re seeing now. More active investors who spotted the V-shaped recovery after exiting on the recession indicator in March—or those who noticed financials leading the market in February 2025 during a late-stage bull market on declining volume—had the chance to exit earlier. They could’ve acted on the first moving average cross of the 21-period moving average and the MACD breakdown. That’s the beauty of being tuned in and nimble. But it’s also a reminder that no strategy is perfect. It’s all about finding the balance between risk, reward, and the level of involvement you’re comfortable with.

The question now is this: For those who exited based on the Lutey Recession Indicator—or even earlier—or held through the selloff, or bought back during the V-shaped recovery after briefly exiting, what’s the market going to do next?
In previous videos, I pointed out that the market might climb to new highs (which it has), but the real concern now is what happens through the rest of the summer, into the fall, and especially October. My guess? By mid-October, we could see investors sitting at levels similar to where they were around the selloff in mid-March. That said, there’s still a chance the market could continue climbing.
The cautionary signals here are clear: the breakdown on the 4-hour RSI, which is mirrored by the daily signal showing the same pattern. These are definitely signs to keep an eye on.

Notice the inverse head and shoulders on the 4-hour chart RSI during the V-Shaped Recovery. Given the past tops have not lead to much of a sell off on the 4-hour chart - paired with a powerful Daily signal may lead to more of a decline. Plus the current market uncertainty and volatility due to international turmoil and Tariff talks.
The 1 hour chart shows an even more powerful signal of a full breakdown on the RSI - so we will see leading into Next week where this heads. And if it means a longer-term selloff on the SP500.

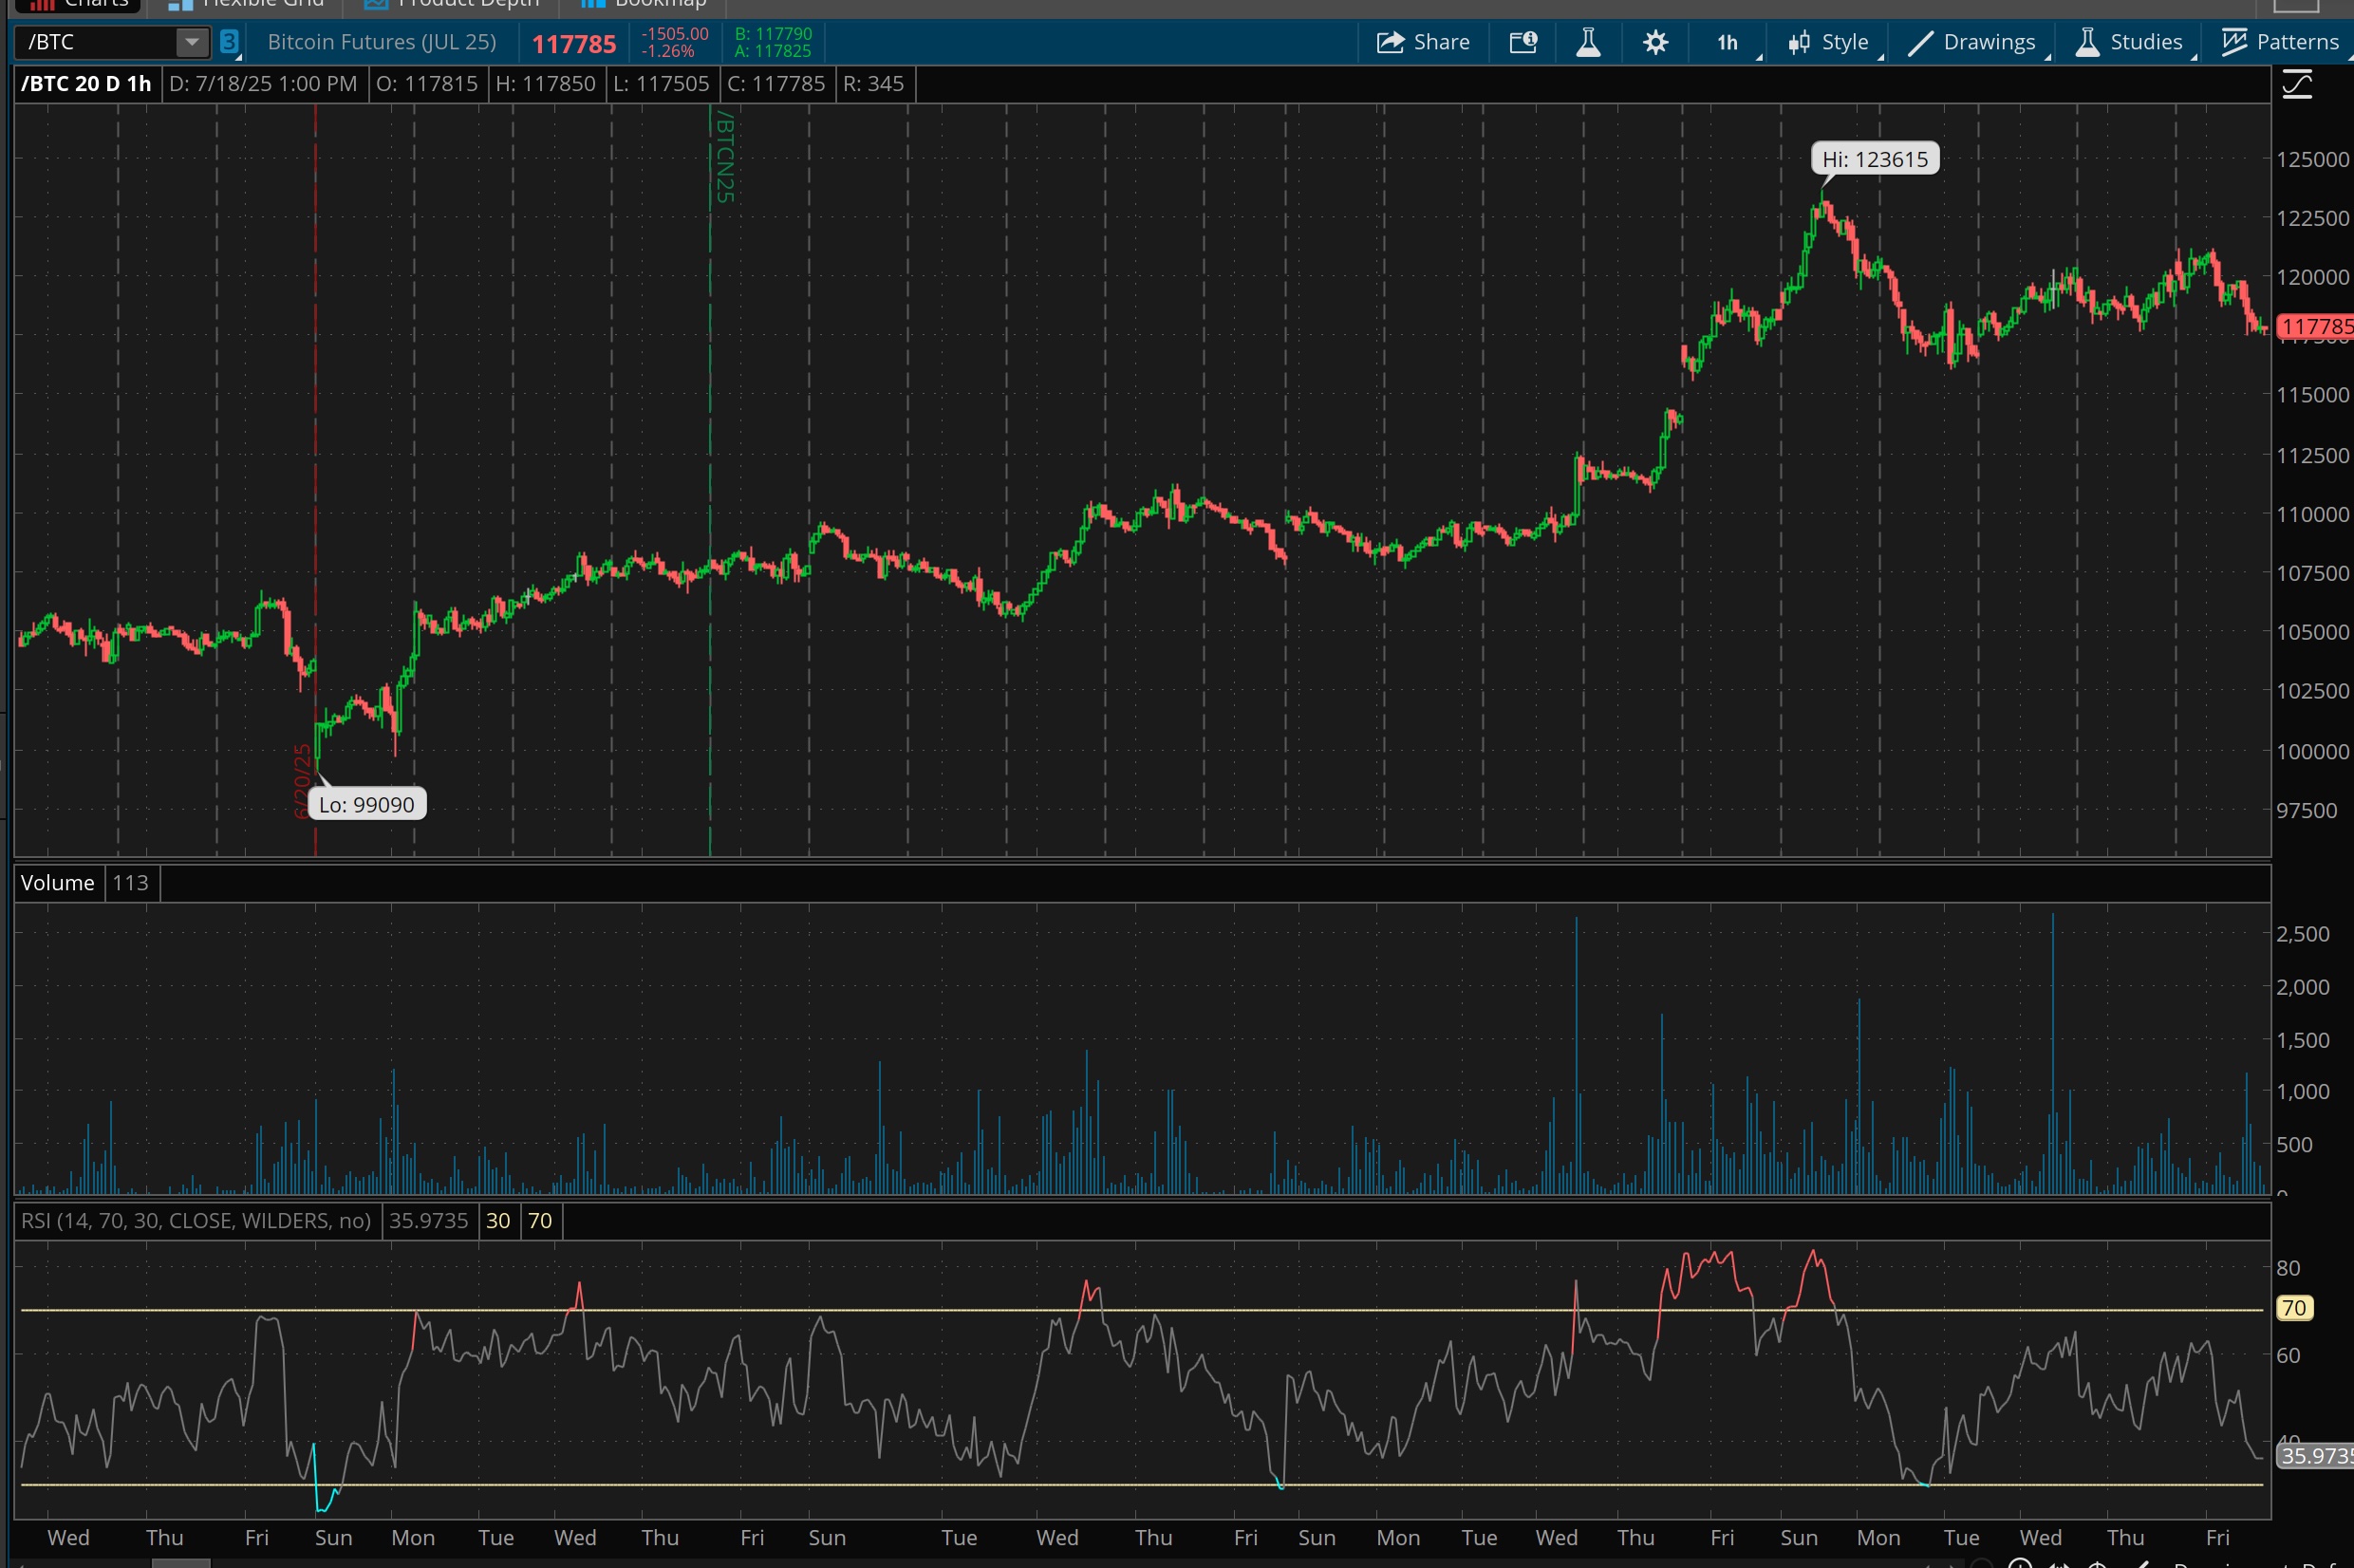
As far as Bitcoin is concerned, I'm seeing a similar pattern with RSI divergence on the Bitcoin futures which is concerning.
The reason I like to take profits as soon as they occur (Larry Williams also is a proponent of this - although I misplaced the title of the book - will update it soon). I believe this works best. You can see several periods where the RSI showed a head and shoulders, or classic breakdown on the bitcoin futures and lead to a brief selloff. The reason I think this one could be more pronounced is that it recently showed a Head and Shoulders top pattern on the RSI (a very powerful signal) and then retest as price came to new highs at 123,615 it is showing both bearish divergence and a classic breakdown and re-test of the price on the daily level.

The 1-hour selloff in Bitcoin Futures is showing a clear breakdown from the recent high. The key thing to watch now is whether the next RSI low drops below the previous one. If it does, that could signal a larger price breakdown is on the horizon.
Given the volatility of Bitcoin and the broader uncertainty in the market, this is definitely a moment to stay sharp. If you’re trading, it’s all about managing risk and keeping an eye on those technical levels. Let’s see how this plays out heading into the next session—this could be a pivotal moment for Bitcoin’s short-term trend.
 On the 4-hour chart, while a break below the 117785 support could signal a deeper selloff in intraday equities, I’ve seen this kind of pattern often set up a strong buy signal at the bottom (support) and then push through the top (resistance). It’s one of those moments where the market could flip the script, so it’s worth keeping a close eye on how it plays out.
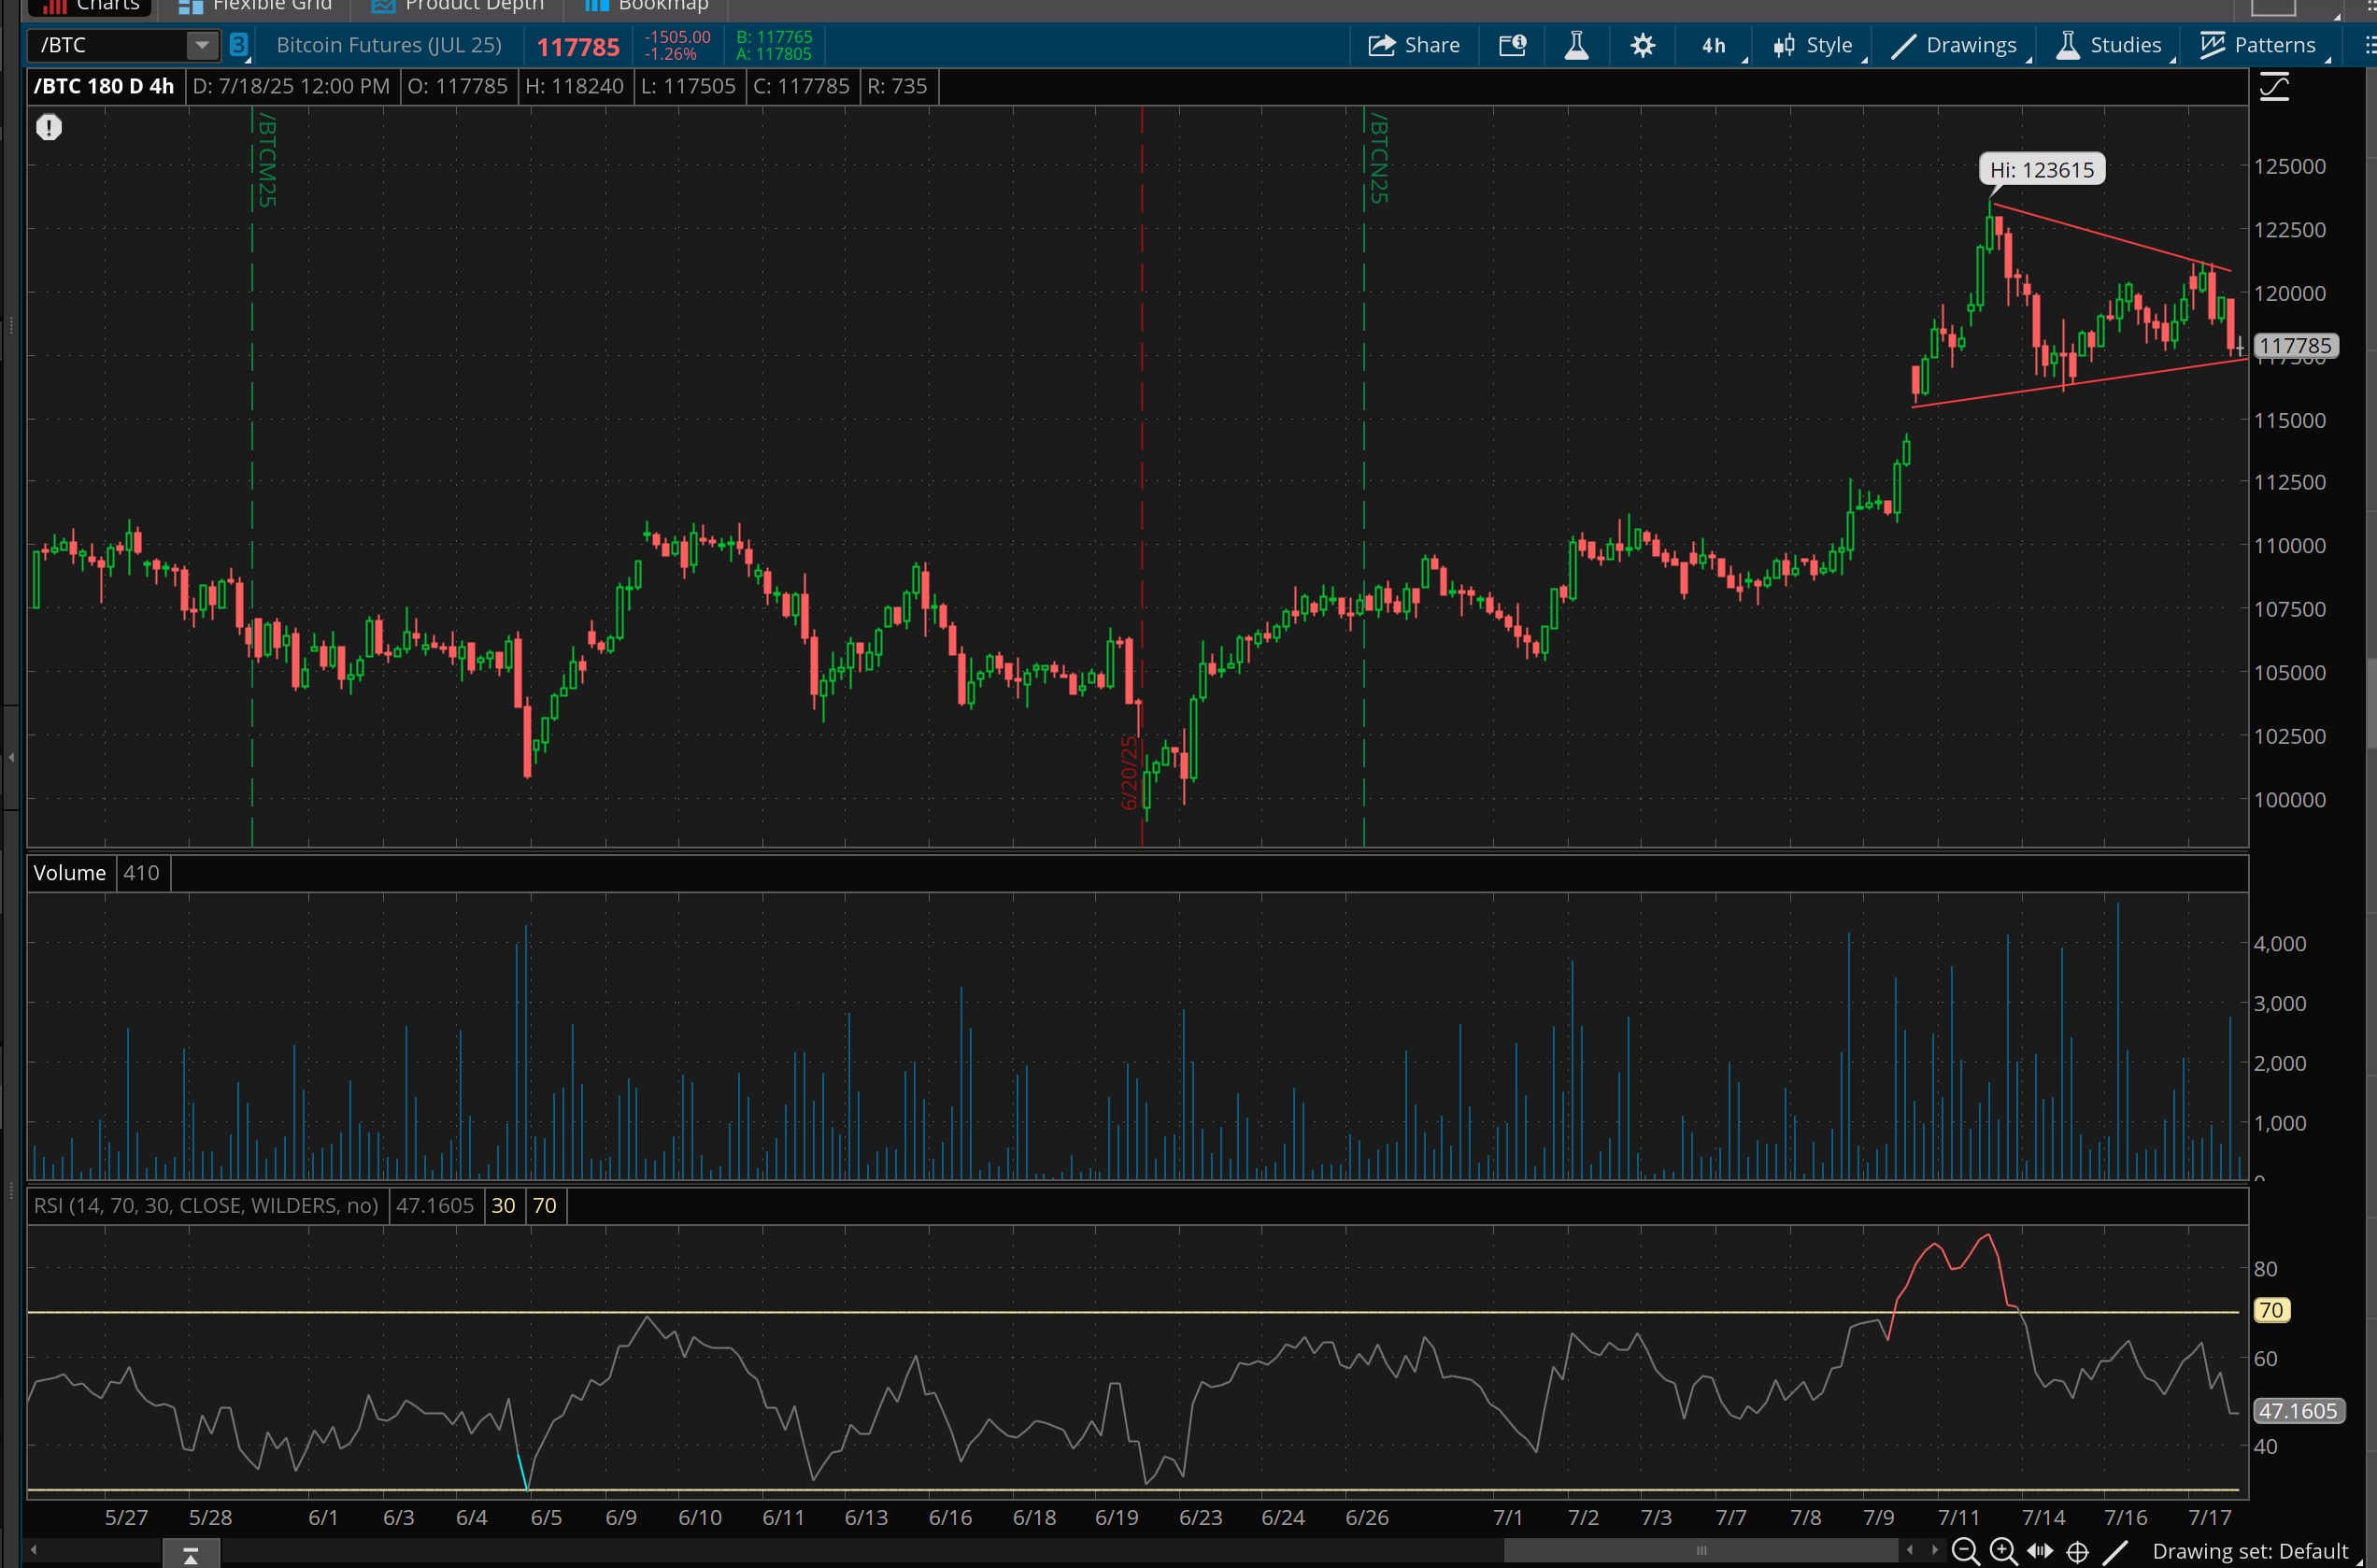
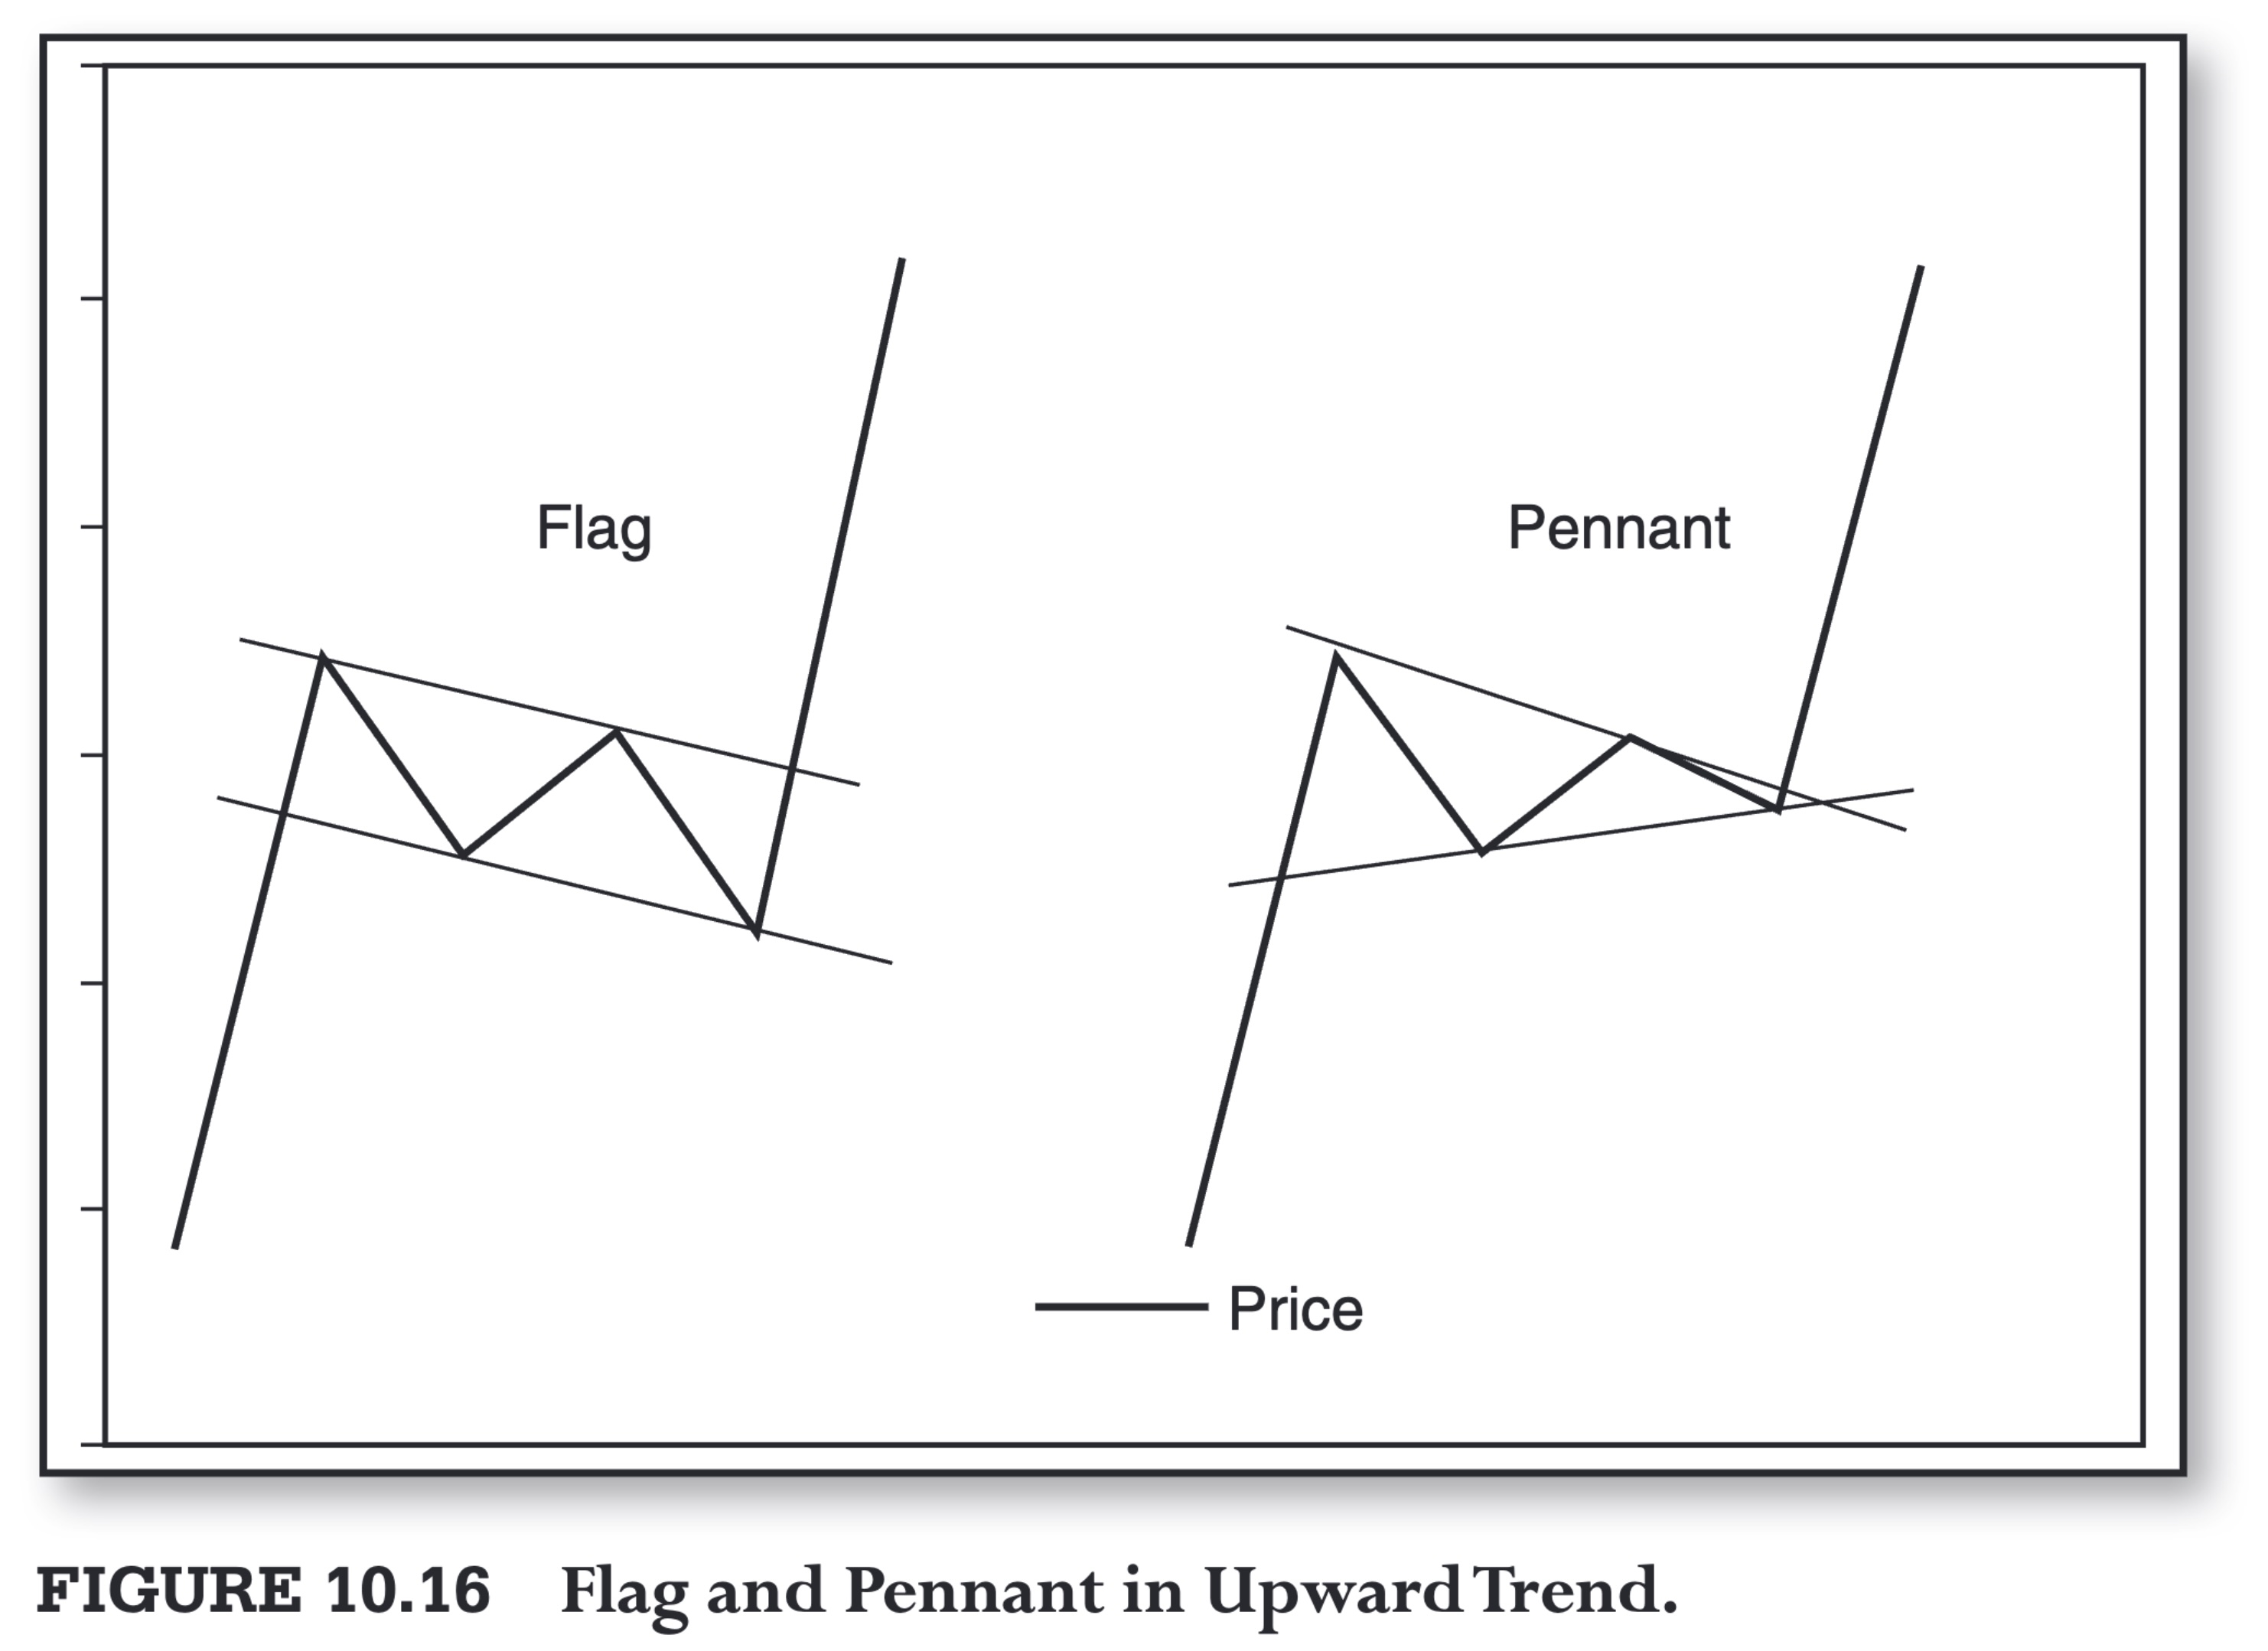
The contrarian take here is that it could actually be forming a pennant, setting up for a breakout to the upside. Definitely worth keeping an eye on. That said, the bigger picture shows the daily chart divergence still looming, and the RSI on the 1-hour chart is clearly breaking down. So, there’s a bit of a tug-of-war happening here—watch how it plays out.

If you're looking to level up your trading and investment game, here's what I've got coming your way:
The All-Access Product I’m building includes everything I’ve covered so far:
Long-Range Lutey Recession Indicator: From the basics (signal creation), to intermediate strategies (recreating it with the yield curve and death cross), and advanced techniques (macro-economic analysis, early detection using volume and sector rotation).
Famous Investor Strategies Rebuilt: Enhanced with Capital Weighted Volume for deeper insights.
Intermediate-Term Trading Signals: Covering equities and futures with daily, 4-hour, and 1-hour time frame signals.
Day Trader Training: Beginner-level content (market terminology) and intermediate-level strategies (technical indicators like RSI, Head and Shoulders patterns).
This all-access product is designed to complement the material from my Undergraduate Investments Class—covering market terminology, intermediate trading signals, futures applications, and time frame analysis. It also ties into the CMT Simulated Trading Competition and my Seminar Course, which dives into advanced macroeconomic overviews, rebuilding famous investor portfolios on Portfolio123.com, and applying these strategies in Bloomberg.
Plus, you’ll get access to two exclusive communities:
A group focused on understanding the famous investor portfolio rebuilds in Portfolio123.com (investment class).
A community dedicated to advanced signals from the Lutey Recession Indicator and real-time sector rotation strategies (seminar class).
Want early access to this product? Join my email list at www.drmattlutey.com/opt-in and grab a free sneak peek at the monthly Famous Investor Portfolio updates. You’ll also get an in-depth look at other offerings, like rebuilding portfolios. Don’t miss out!
Follow the Lutey Recession Indicator for more technical annalysis insights applied to the Sp500 and crypto.