Sharpe & Sortino in Action: A Real-Time Portfolio Focused on Risk-Adjusted Returns
May 14, 2026Sharpe & Sortino in Action: A Real-Time Portfolio Focused on Risk-Adjusted Returns
Markets don’t reward investors simply for taking risk. They reward investors for taking efficient risk.
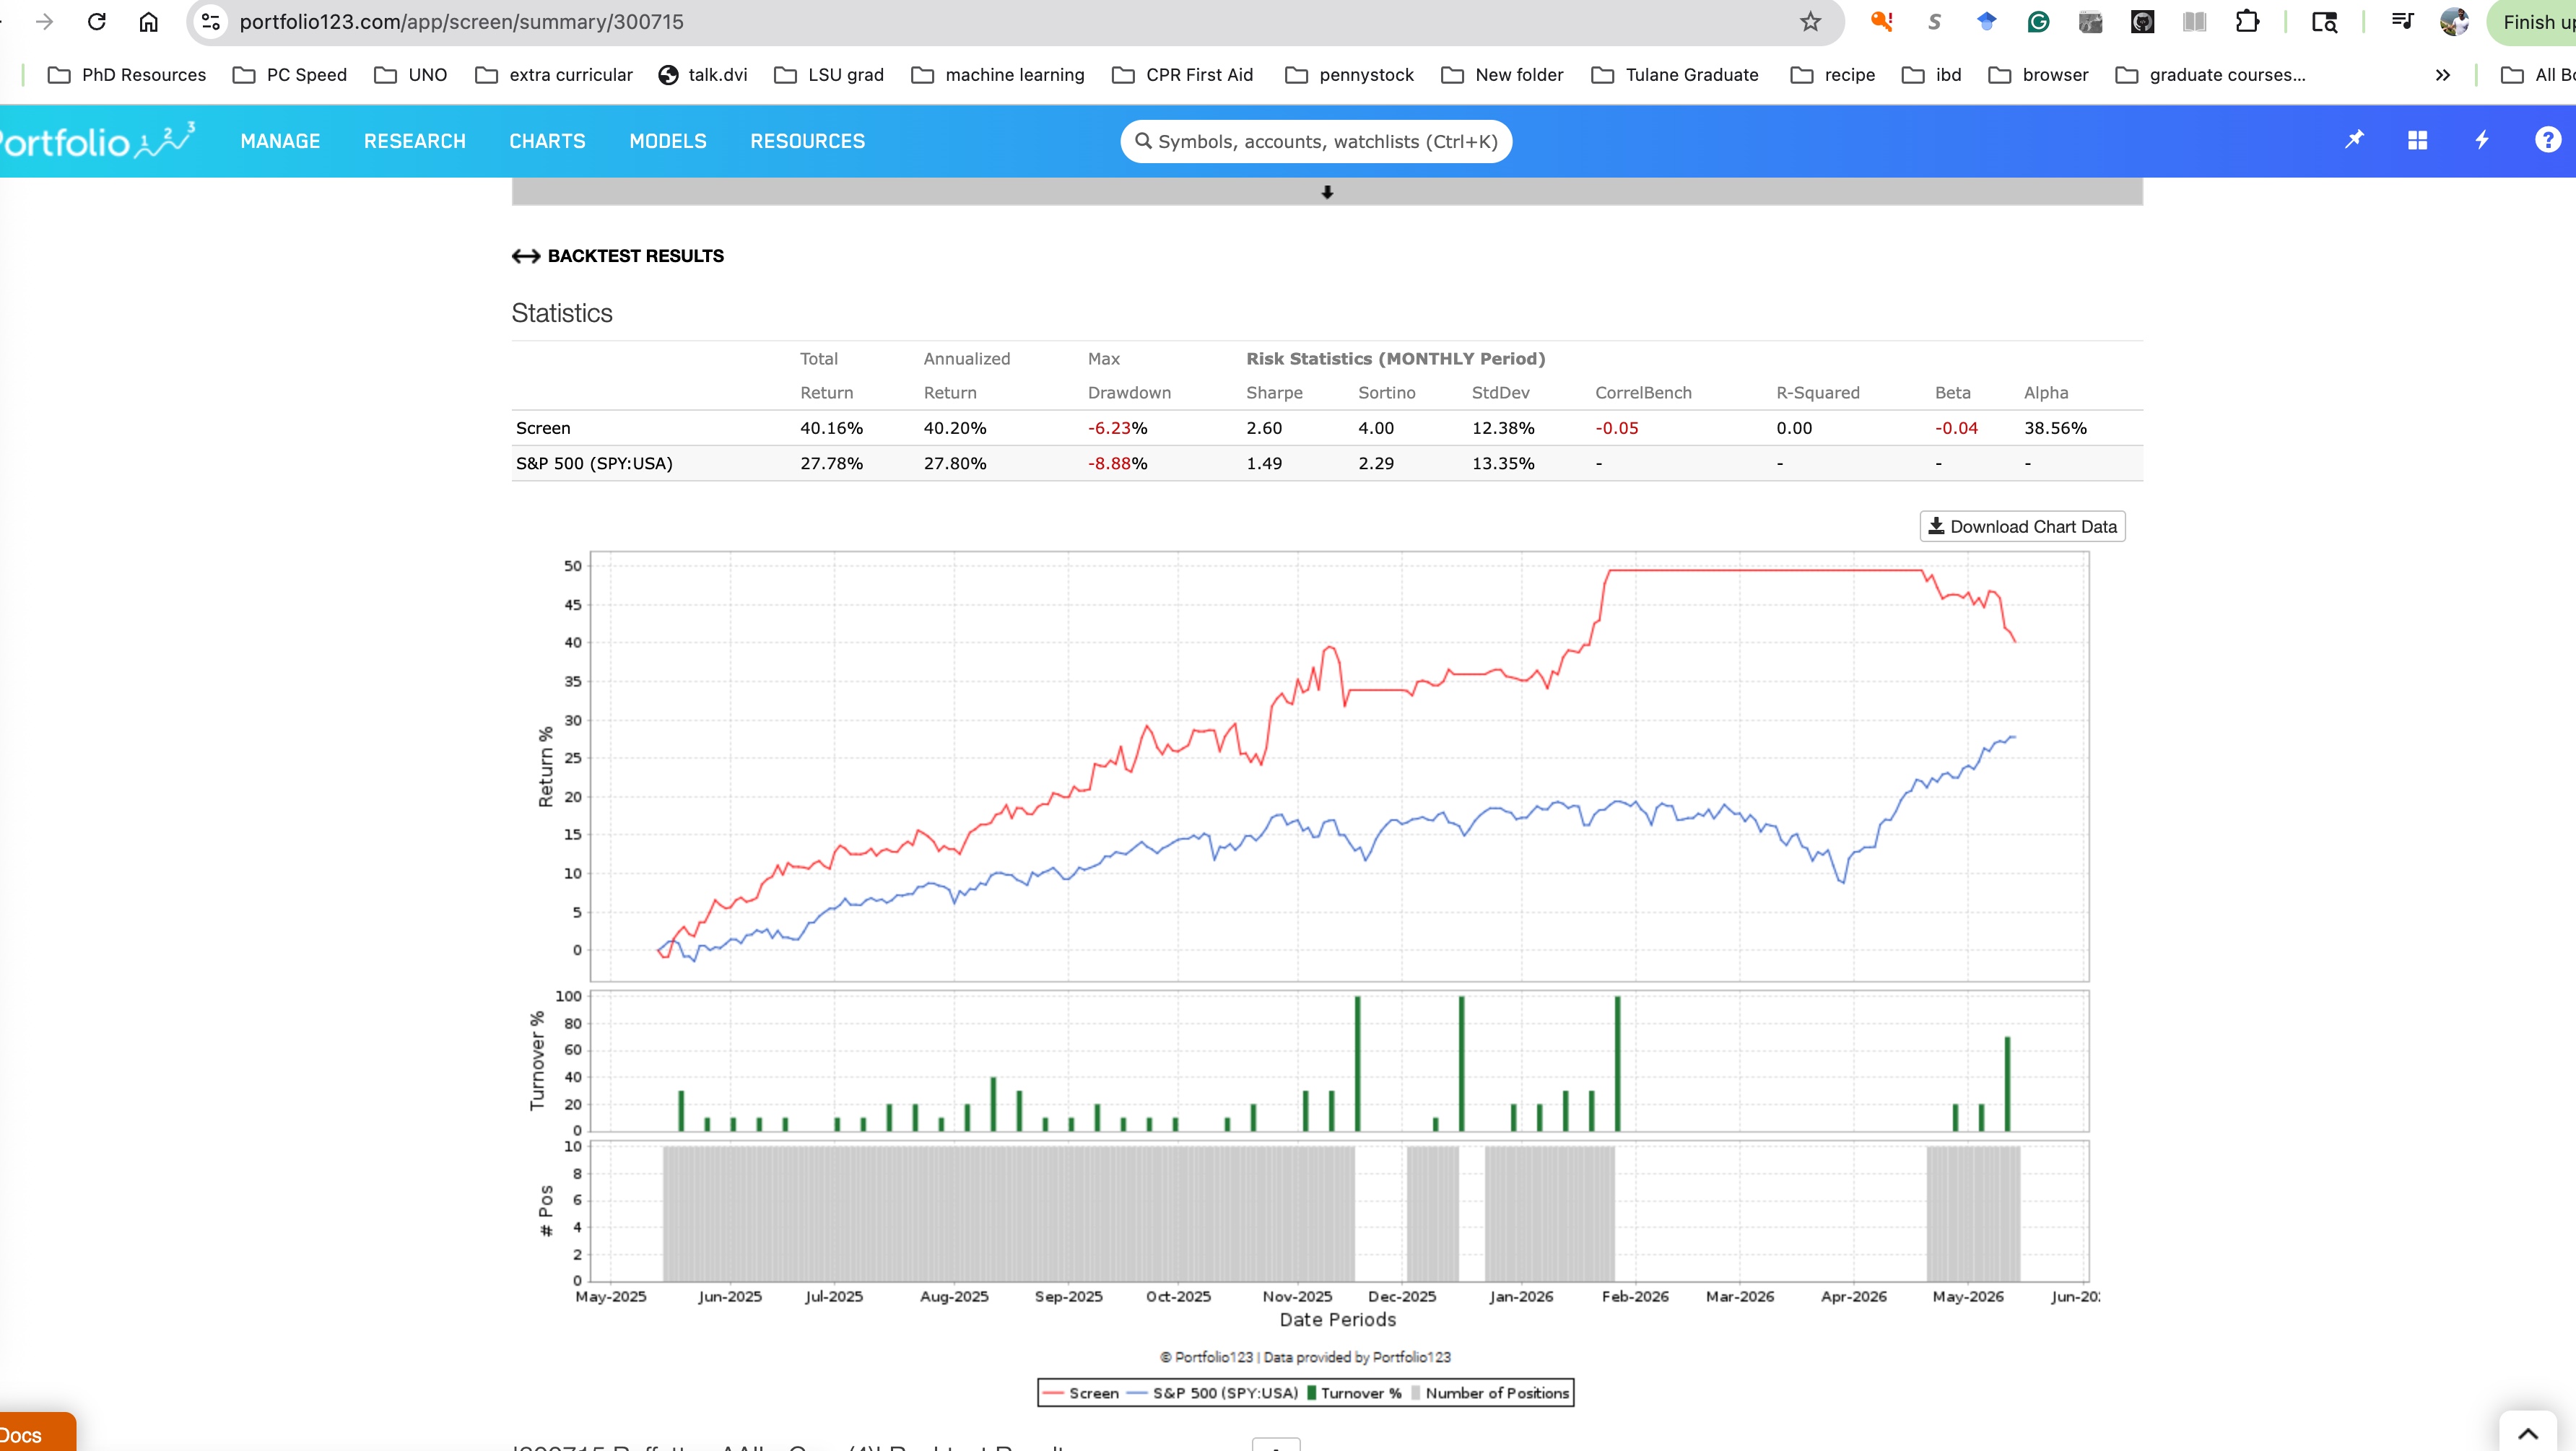
Over the last year, this real-time portfolio model focused on high Sharpe Ratio and Sortino Ratio characteristics has significantly outperformed the S&P 500 while maintaining lower drawdowns and stronger risk-adjusted metrics.
The result:
-
40.16% total return
-
40.20% annualized return
-
Sharpe Ratio: 2.60
-
Sortino Ratio: 4.00
-
Maximum Drawdown: -6.23%
Compared to the benchmark:
-
S&P 500 Return: 27.78%
-
Sharpe Ratio: 1.49
-
Sortino Ratio: 2.29
-
Max Drawdown: -8.88%
This means the portfolio not only generated higher returns, but did so with more efficient downside control and better consistency of returns per unit of risk taken.
Why Sharpe and Sortino Matter
Many investors focus only on returns.
Professional portfolio construction focuses on:
-
Return
-
Volatility
-
Downside volatility
-
Drawdown control
-
Risk-adjusted efficiency
The Sharpe Ratio measures how much return is generated for each unit of total volatility.
The formula is:
\text{Sharpe Ratio} = \frac{R_p - R_f}{\sigma_p}
Where:
-
(R_p) = portfolio return
-
(R_f) = risk-free rate
-
(\sigma_p) = portfolio volatility
A Sharpe Ratio above 1.0 is generally considered strong.
Above 2.0 is considered exceptional.
This portfolio achieved 2.60 over the last year in live real-time tracking.
The Sortino Ratio improves upon the Sharpe Ratio by only penalizing downside volatility rather than upside movement.
\text{Sortino Ratio} = \frac{R_p - R_f}{\sigma_d}
Where:
-
(\sigma_d) = downside deviation
This matters because investors typically don’t mind upside volatility — they mind losses.
A 4.00 Sortino Ratio indicates the portfolio produced extremely strong upside relative to harmful downside movement.
Real-Time Performance vs the Market
One of the most important aspects of this model is that the results are being tracked in real time rather than purely in-sample historical testing.
Over the last year:
-
The portfolio maintained substantial outperformance versus the S&P 500
-
Drawdowns remained smaller than the benchmark
-
Risk-adjusted returns remained significantly higher
-
Correlation to the benchmark stayed relatively low
The model benefited from:
-
Tactical momentum exposure
-
Higher quality leading stocks
-
Relative strength leadership
-
Risk management overlays
-
Efficient position rotation
The equity curve demonstrates periods where the portfolio separated sharply from the benchmark during favorable momentum environments while also controlling downside exposure during weaker market periods.
Why This Matters for Investors
Many investors unknowingly take:
-
Excessive concentration risk
-
Poorly timed exposure
-
Emotional drawdowns
-
Low-quality volatility
A portfolio with a higher Sharpe and Sortino profile seeks to solve a different problem:
How do we maximize return per unit of downside risk taken?
That distinction is critical.
A portfolio that compounds steadily with smaller drawdowns can often outperform over long periods because:
-
Less capital is lost during declines
-
Recovery periods are shorter
-
Investors are more likely to stay disciplined
-
Compounding works more efficiently
The Bigger Picture
This model reflects the broader philosophy behind tactical portfolio construction:
-
Identify leading stocks
-
Focus on relative strength and momentum
-
Monitor market conditions continuously
-
Adjust exposure when risk conditions deteriorate
-
Emphasize both return and risk efficiency
The goal is not simply to “beat the market.”
The goal is to produce:
-
Better risk-adjusted returns
-
More efficient compounding
-
Lower downside volatility
-
Stronger long-term consistency
Over the last year, the results suggest that disciplined portfolio construction focused on Sharpe and Sortino optimization can meaningfully improve investor outcomes compared to passive benchmark exposure.
Final Thoughts
High returns alone are not enough.
The quality of those returns matters.
Over the last year, this real-time model demonstrated:
-
Higher returns than the S&P 500
-
Lower drawdowns
-
Higher Sharpe Ratio
-
Higher Sortino Ratio
-
Stronger risk-adjusted efficiency
For investors looking beyond simple buy-and-hold indexing, risk-adjusted portfolio construction may offer a more durable framework for long-term capital growth.