Live out of sample performance - CAN SLIM SP500 Strategy (in real time)
May 16, 2026CAN SLIM S&P 500 Model with VPCI Overlay: Live Out-of-Sample Performance Review
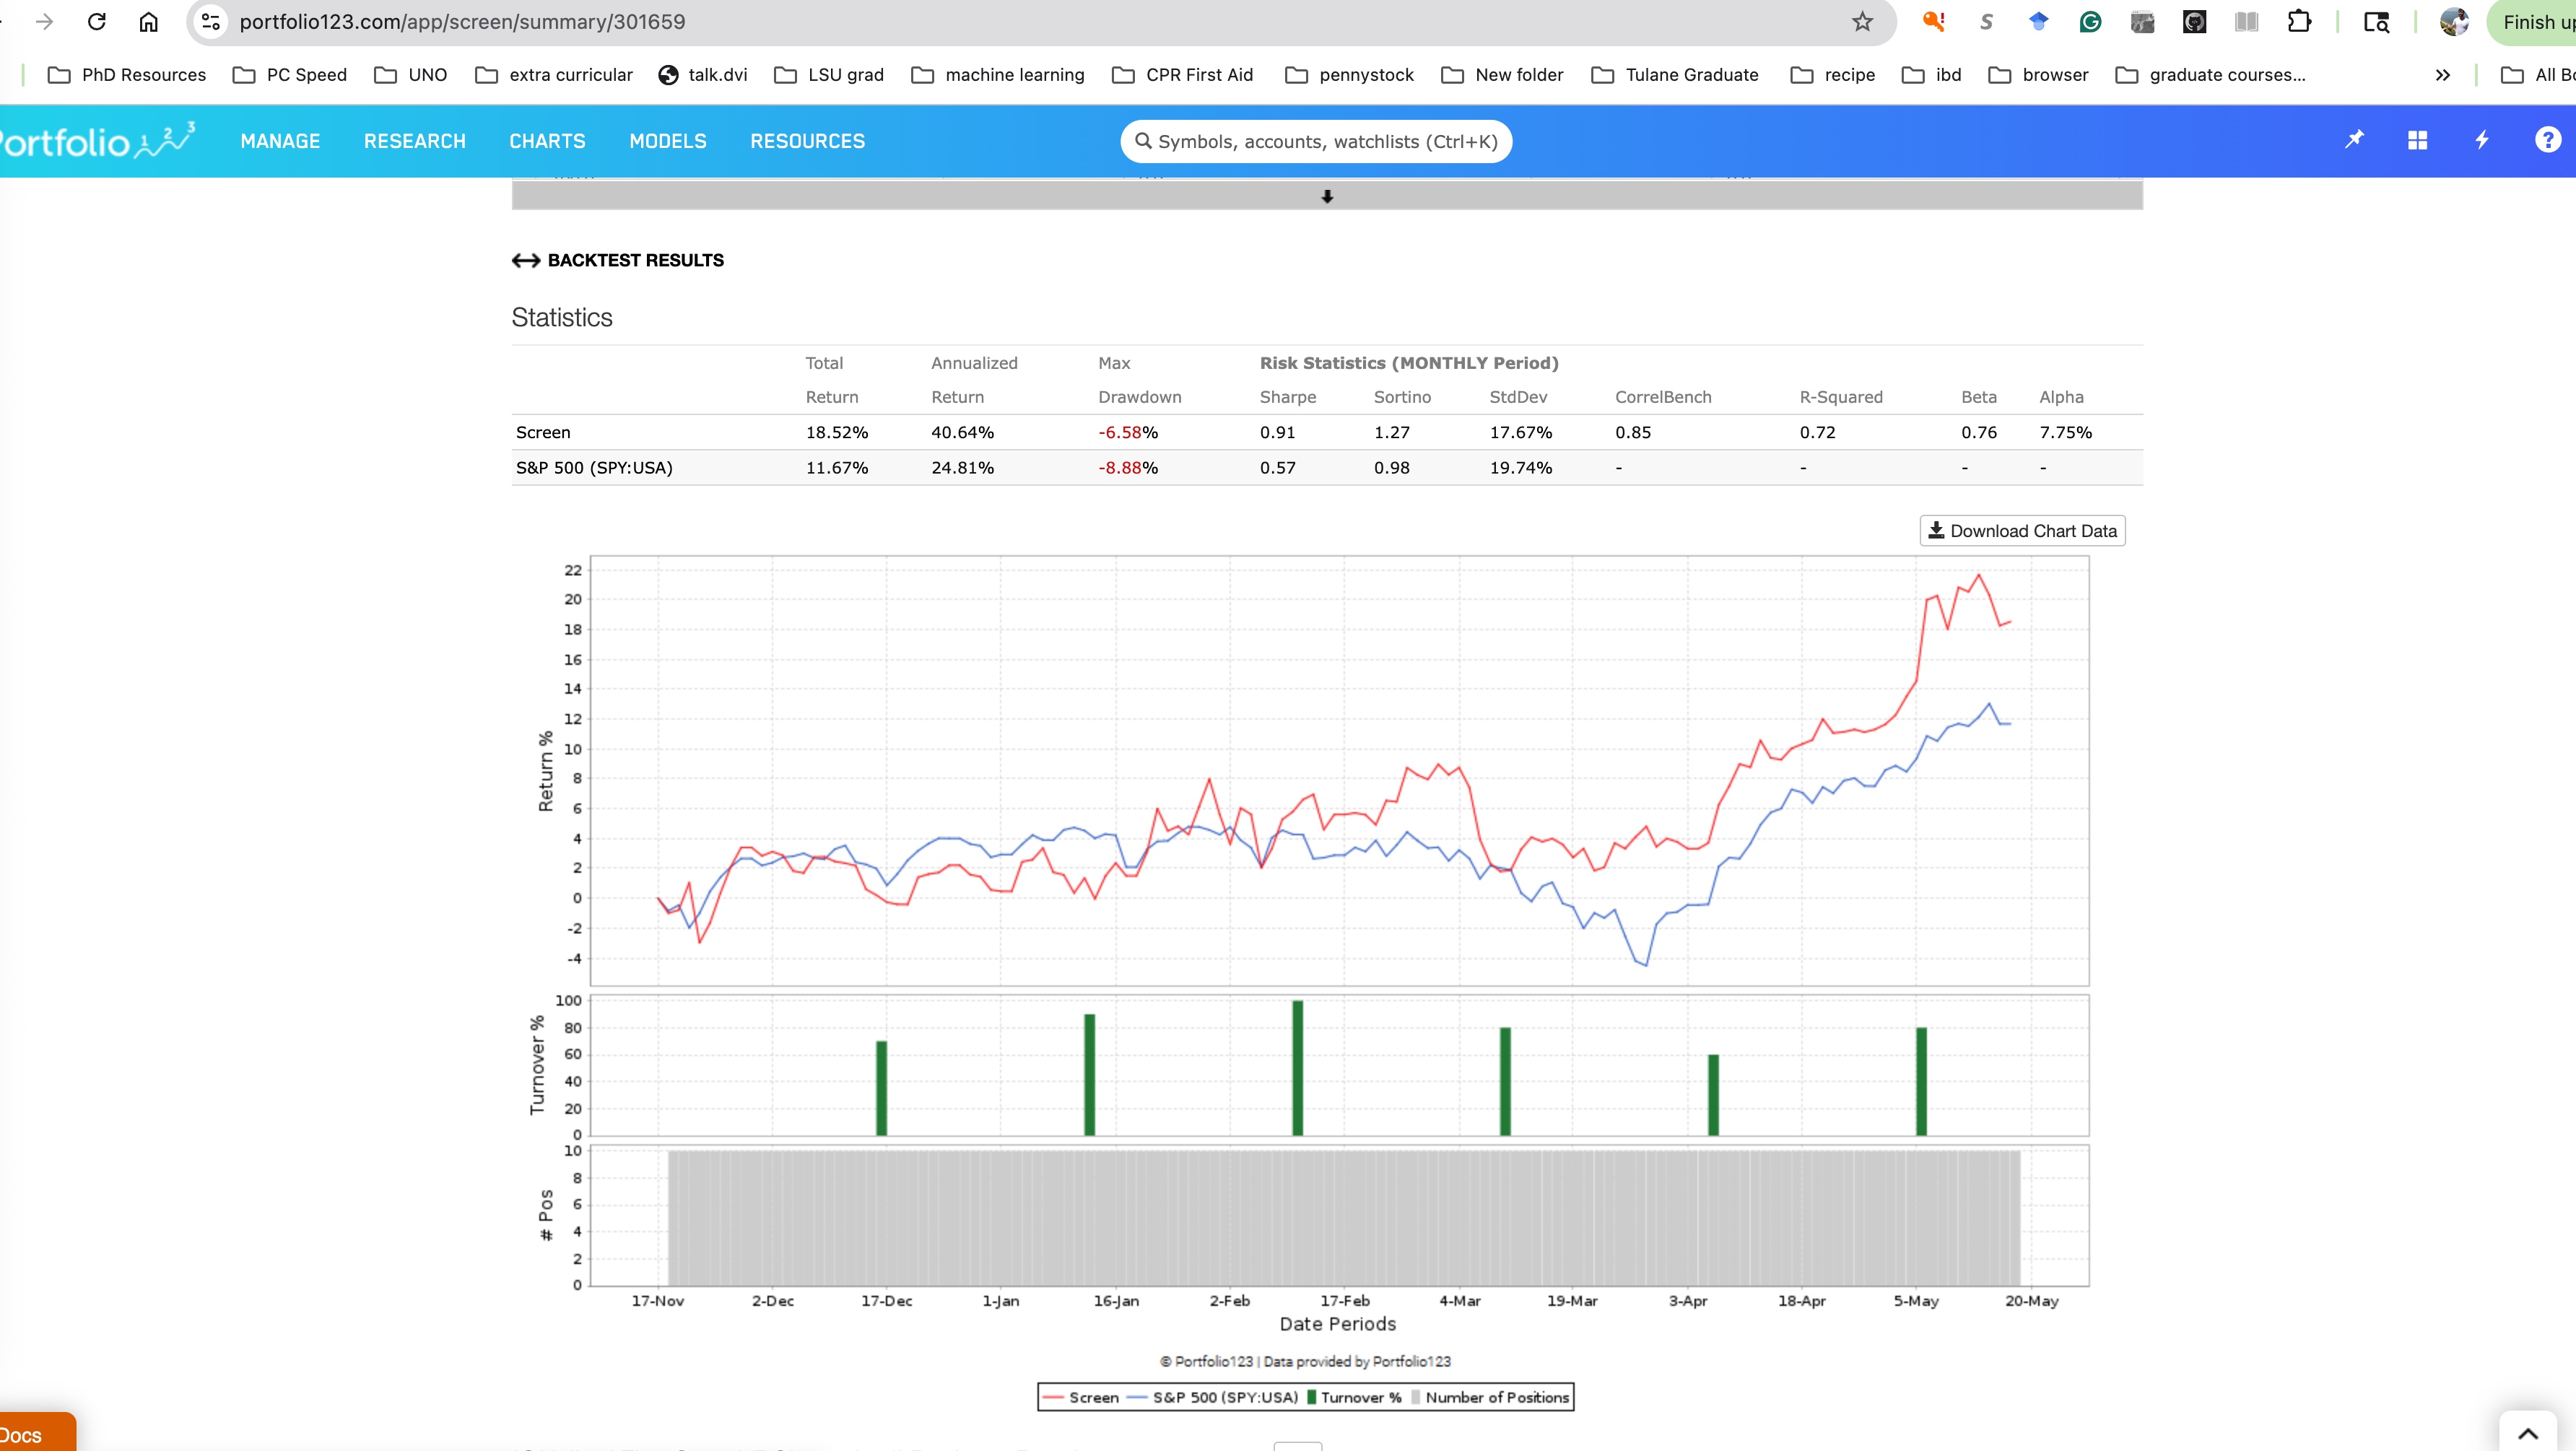
The chart below highlights the recent performance of the CAN SLIM S&P 500 model enhanced with the Volume Price Confirmation Indicator (VPCI) overlay. The red line represents the strategy performance, while the blue line represents the S&P 500 benchmark over the same period.
This model focuses on identifying leadership stocks within the S&P 500 using a combination of fundamental growth characteristics and technical confirmation through price and volume behavior. The goal is not simply to outperform during strong markets, but to improve risk-adjusted returns and reduce downside exposure during weaker periods.
Performance Overview
From the backtest period shown:
-
Strategy Total Return: 18.52%
-
S&P 500 Return: 11.67%
-
Excess Return: +6.85%
-
Annualized Return: 40.64%
-
Maximum Drawdown: -6.58%
-
Benchmark Drawdown: -8.88%
The strategy generated a higher return while simultaneously experiencing a smaller drawdown than the benchmark. This combination is one of the key objectives of tactical portfolio construction — capturing upside participation while reducing exposure during periods of market weakness.
Risk-Adjusted Metrics
The model also improved several important risk-adjusted statistics:
-
Sharpe Ratio: 0.91 vs 0.57 for the S&P 500
-
Sortino Ratio: 1.27 vs 0.98
-
Standard Deviation: 17.67% vs 19.74%
-
Alpha: 7.75%
-
Beta: 0.76
A beta below 1.0 suggests the portfolio moved with less volatility than the overall market while still generating stronger returns. The positive alpha indicates that the excess return was not simply due to market exposure, but rather from stock selection and tactical positioning.
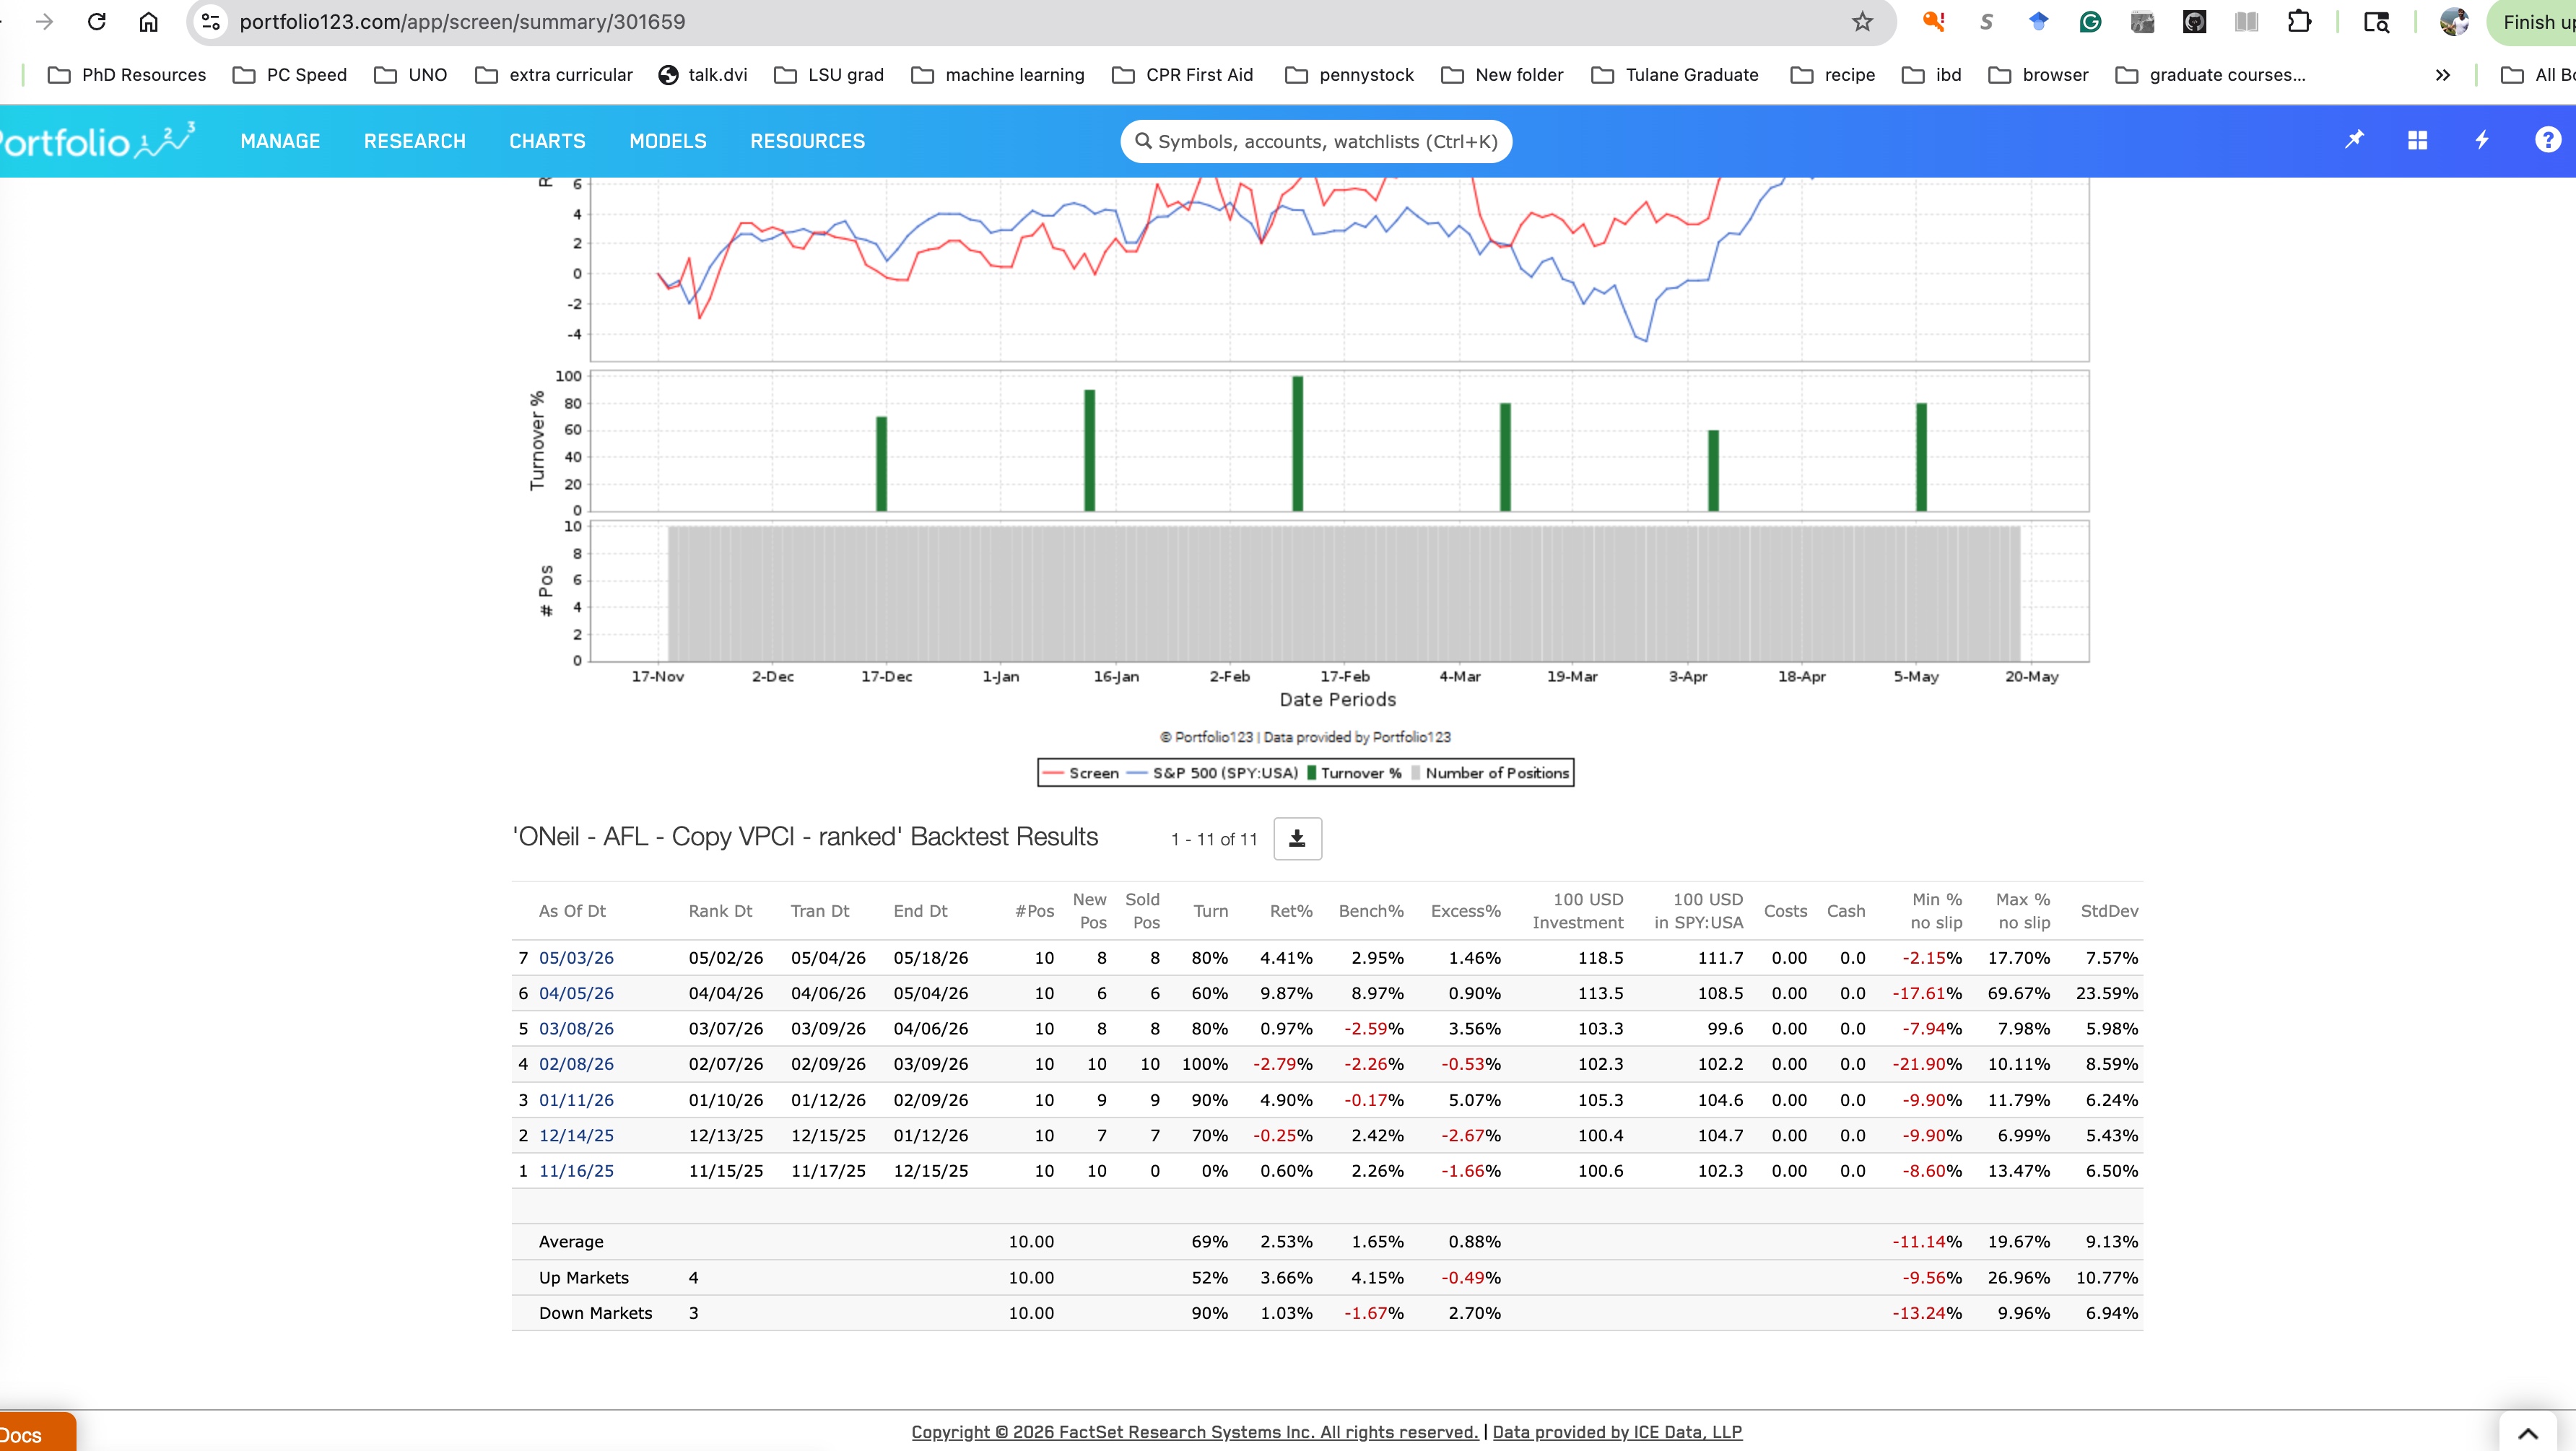
Breaking Down the Monthly Return Table
The table below the chart shows each rebalance period and compares the strategy return to the S&P 500 benchmark.
The most important column is the Excess% column:
-
Positive values indicate the strategy outperformed the S&P 500 during that rebalance period.
-
Negative values indicate periods where the benchmark slightly outperformed.
Example Periods
January to February
-
Strategy Return: 4.90%
-
Benchmark Return: -0.17%
-
Excess Return: +5.07%
During this period, the model significantly outperformed while the broader market was relatively flat.
March to April
-
Strategy Return: 0.97%
-
Benchmark Return: -2.59%
-
Excess Return: +3.56%
This period highlights one of the primary goals of the model: maintaining relative strength during periods where the market weakens.
April to May
-
Strategy Return: 9.87%
-
Benchmark Return: 8.97%
-
Excess Return: +0.90%
The model continued participating during the rebound phase while maintaining strong leadership exposure.
Understanding the Graph
The chart visually demonstrates several important dynamics:
-
The red strategy line generally trends above the blue benchmark line over time.
-
During market weakness in March and early April, the strategy experienced a noticeably smaller decline than the S&P 500.
-
As the market recovered, the model accelerated into new highs faster than the benchmark.
The green turnover bars show portfolio rotation during rebalance periods. Higher turnover reflects the model adapting to changing leadership stocks and momentum conditions.
Why the Model Works
The framework combines several layers:
-
CAN SLIM-style stock selection
-
Earnings growth
-
Relative strength
-
Institutional accumulation
-
Leadership characteristics
-
-
VPCI confirmation
-
Uses volume-weighted behavior to confirm price trends
-
Attempts to avoid weak rallies lacking institutional participation
-
-
Risk management overlays
-
Tactical exposure adjustments
-
Relative strength ranking
-
Momentum confirmation
-
The combination aims to systematically identify strong stocks while reducing exposure to deteriorating market conditions.
Live Out-of-Sample Focus
One of the most important aspects of this research is the focus on live, out-of-sample testing rather than purely optimized historical simulations.
The objective is to build repeatable portfolio processes that can be implemented in real markets with realistic rebalance schedules and practical turnover levels.
Final Thoughts
While no strategy outperforms in every individual period, the broader goal of this model is consistency over time:
-
Strong relative performance
-
Improved downside control
-
Reduced volatility
-
Systematic leadership exposure
-
Repeatable portfolio construction
The current results demonstrate how combining CAN SLIM principles with VPCI-based confirmation can potentially improve both return and risk characteristics relative to a passive S&P 500 allocation.
If you are interested in learning how to build or implement models like this in practice, including Portfolio123 screening logic, ranking systems, VPCI overlays, and portfolio construction methodology, coaching and consulting sessions are available for rebuilding the strategy step-by-step. The trailing 6 month performance is shown below: