Famous Investor Portfolios: Graham + Volume Price Confirmation Indicator
Built and taught by Dr. Matt Lutey, PhD (Finance) — professor, researcher, and portfolio architect — this model combines the timeless discipline of Benjamin Graham-style value investing with modern volume-based trend confirmation.
This is not theory. It is a structured, rules-based portfolio approach designed to systematically identify high-quality stocks before major price expansion.
What You’ll Get
1. Graham-Inspired Model Portfolios (All U.S. Stocks + Foreign Primary Listings)
A complete screening framework based on the principles of legendary investor Benjamin Graham, applied across the full U.S. equity universe — including foreign primary listings trading in U.S. markets.
2. Volume Price Confirmation Indicator (VPCI) Overlay
Traditional value screens identify undervalued companies.
The VPCI overlay helps identify when institutional participation confirms the move.
This combination allows you to:
-
Filter fundamentally strong companies
-
Detect emerging accumulation
-
Identify passing stocks before technical breakout
-
Avoid value traps lacking volume confirmation
3. Pre-Breakout Identification Framework
Using the Lutey Growth – Benjamin Graham methodology, you’ll learn how to:
-
Identify stocks that pass strict valuation criteria
-
Confirm trend strength through volume-price alignment
-
Enter during structural momentum shifts
-
Follow a repeatable allocation and risk management framework
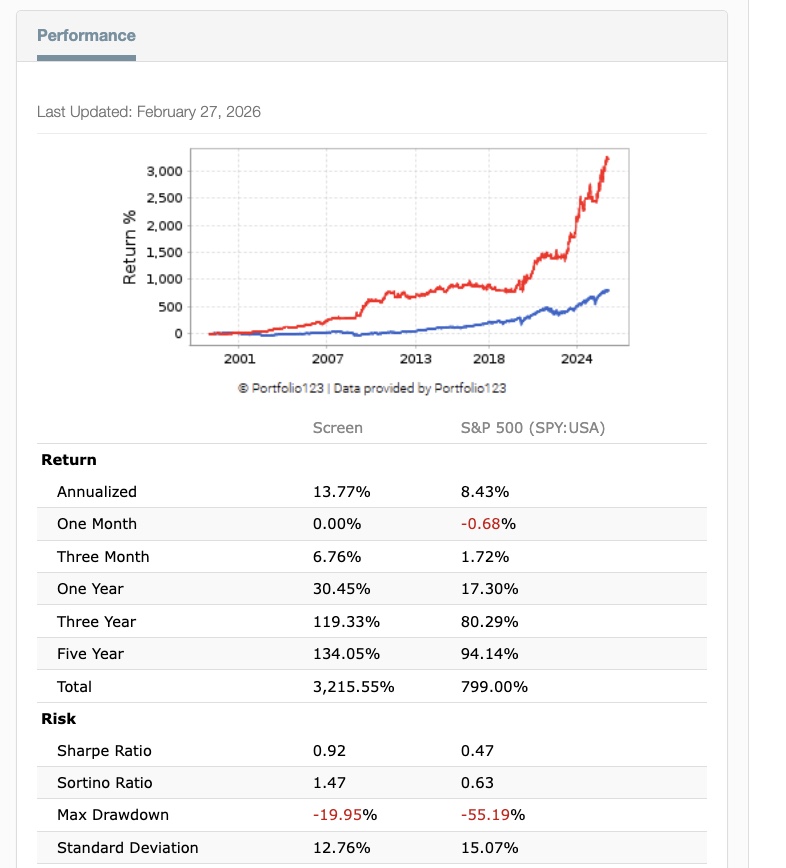
Historical Model Performance
Growth of a $100 investment starting in 1999 is shown below — applying this same disciplined, rules-based Graham + VPCI strategy.
The results demonstrate how combining:
can systematically outperform passive indexing while managing downside risk.
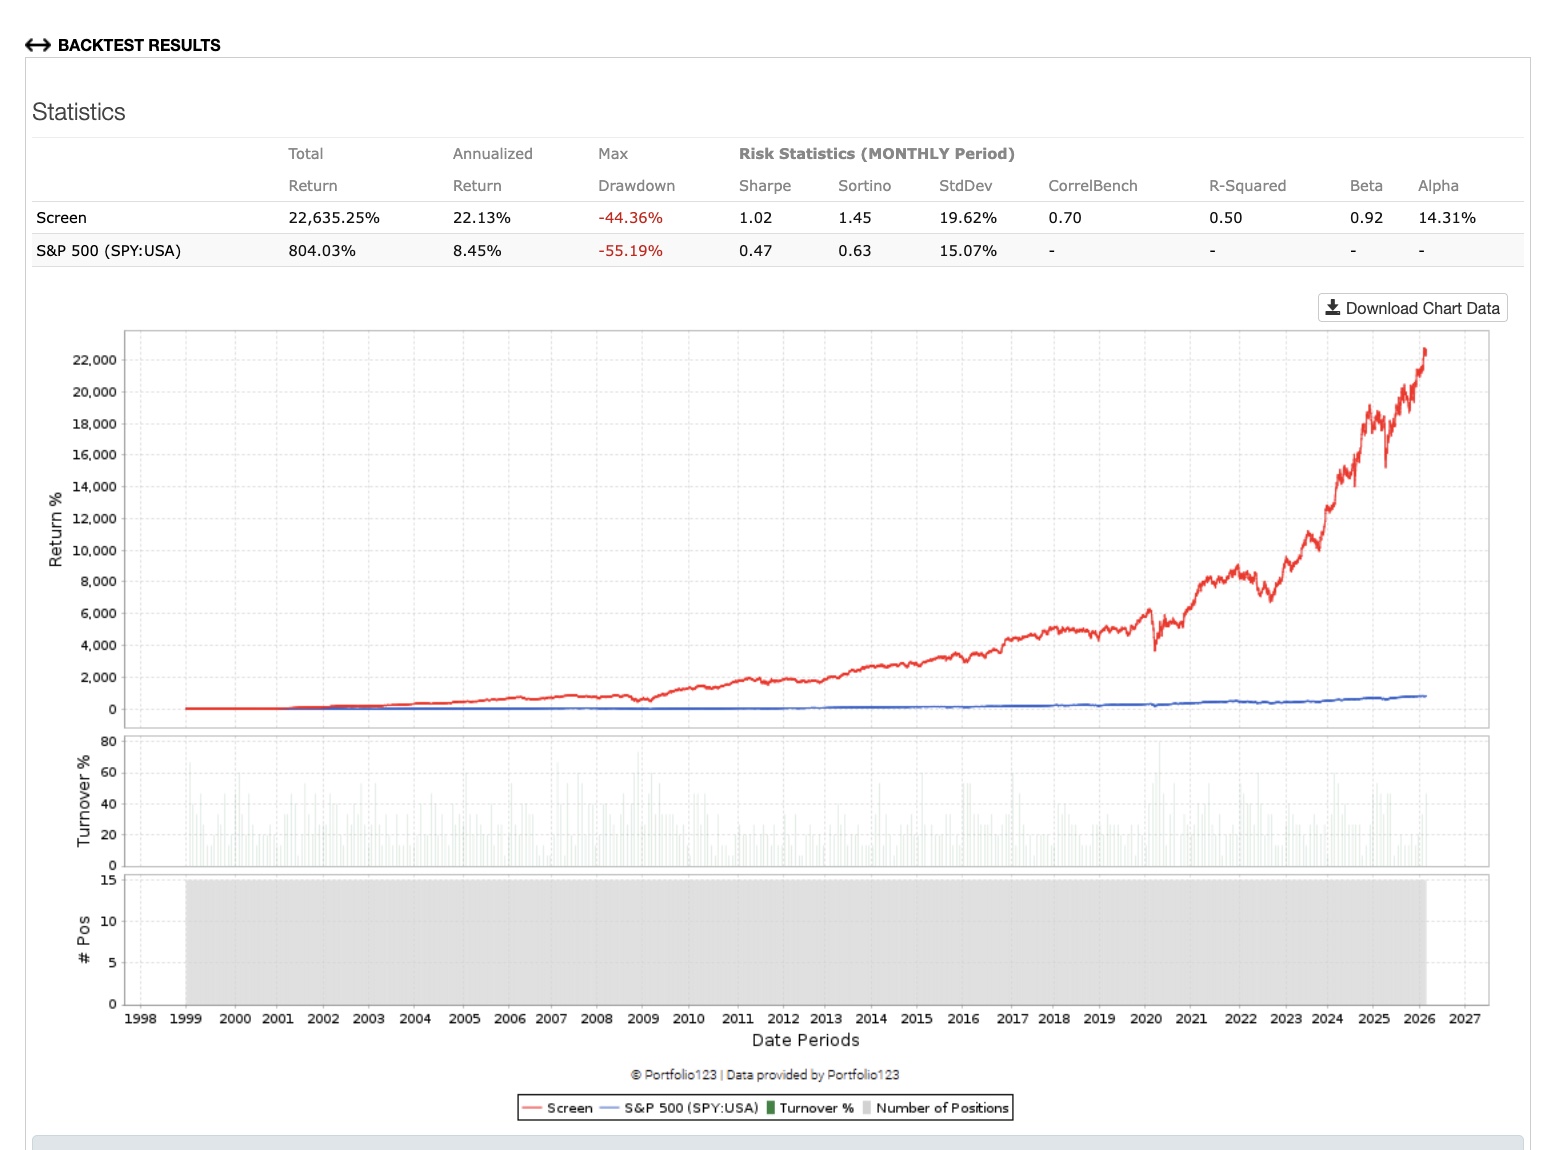
Review performance across multiple historical look-back periods. The portfolios demonstrate consistent improvements in both Sharpe and Sortino ratios relative to the S&P 500, reflecting stronger risk-adjusted returns.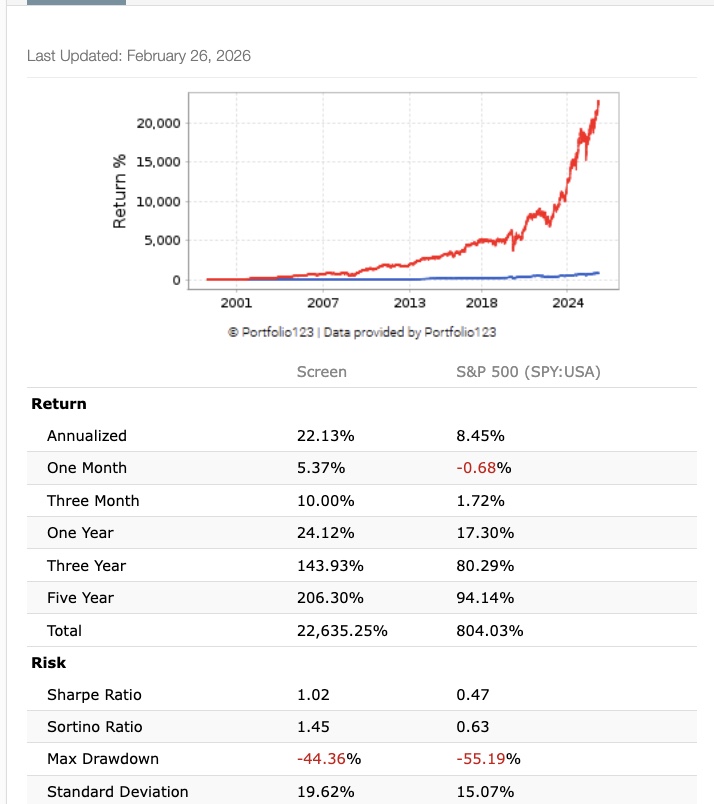
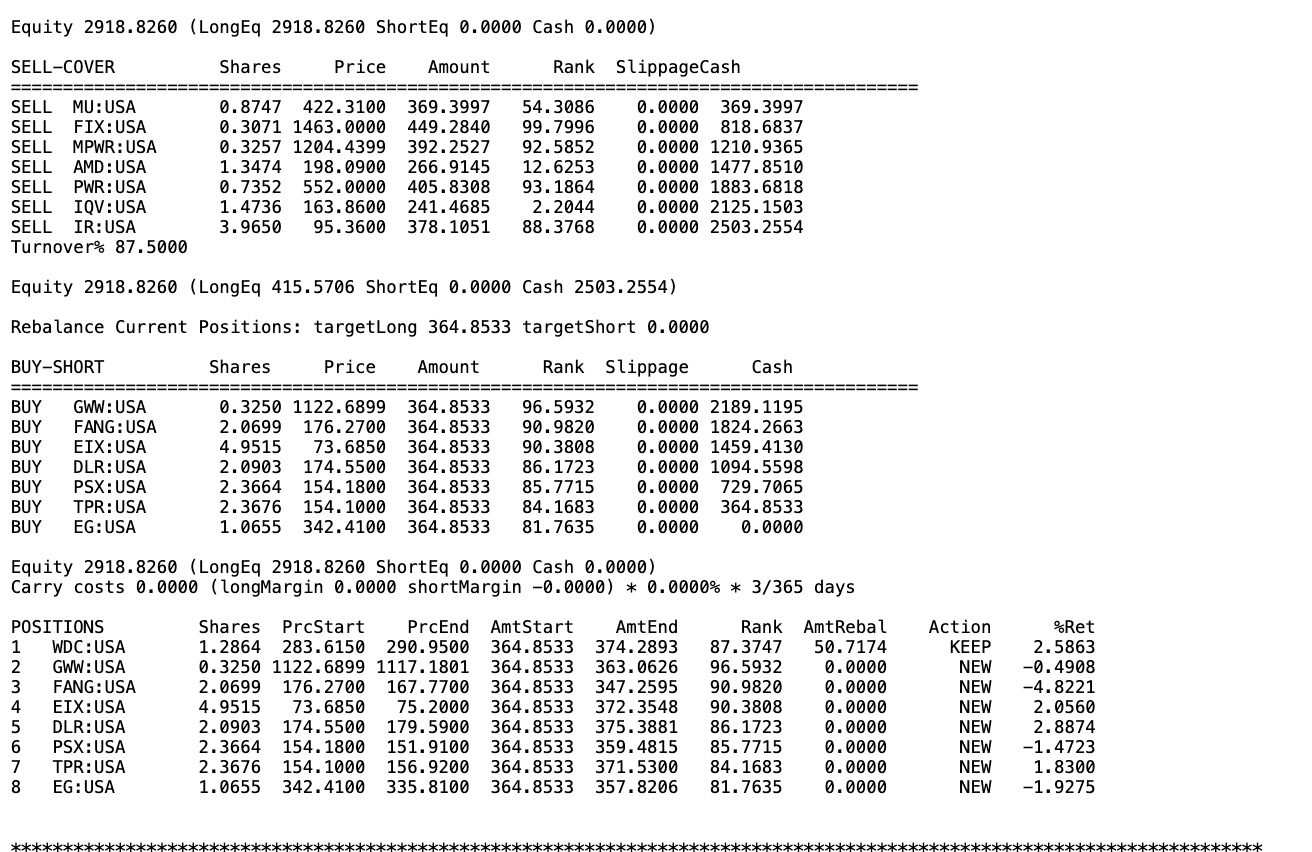
A sample newsletter rebalance walks follows through the portfolio updates each month in real time - so you can follow the investment performance without the rigorous research required to build the model.
Achieve further risk reduction with the Capital Weighted Volume weekly Risk Overlay. A sample performance comparison is shown below:
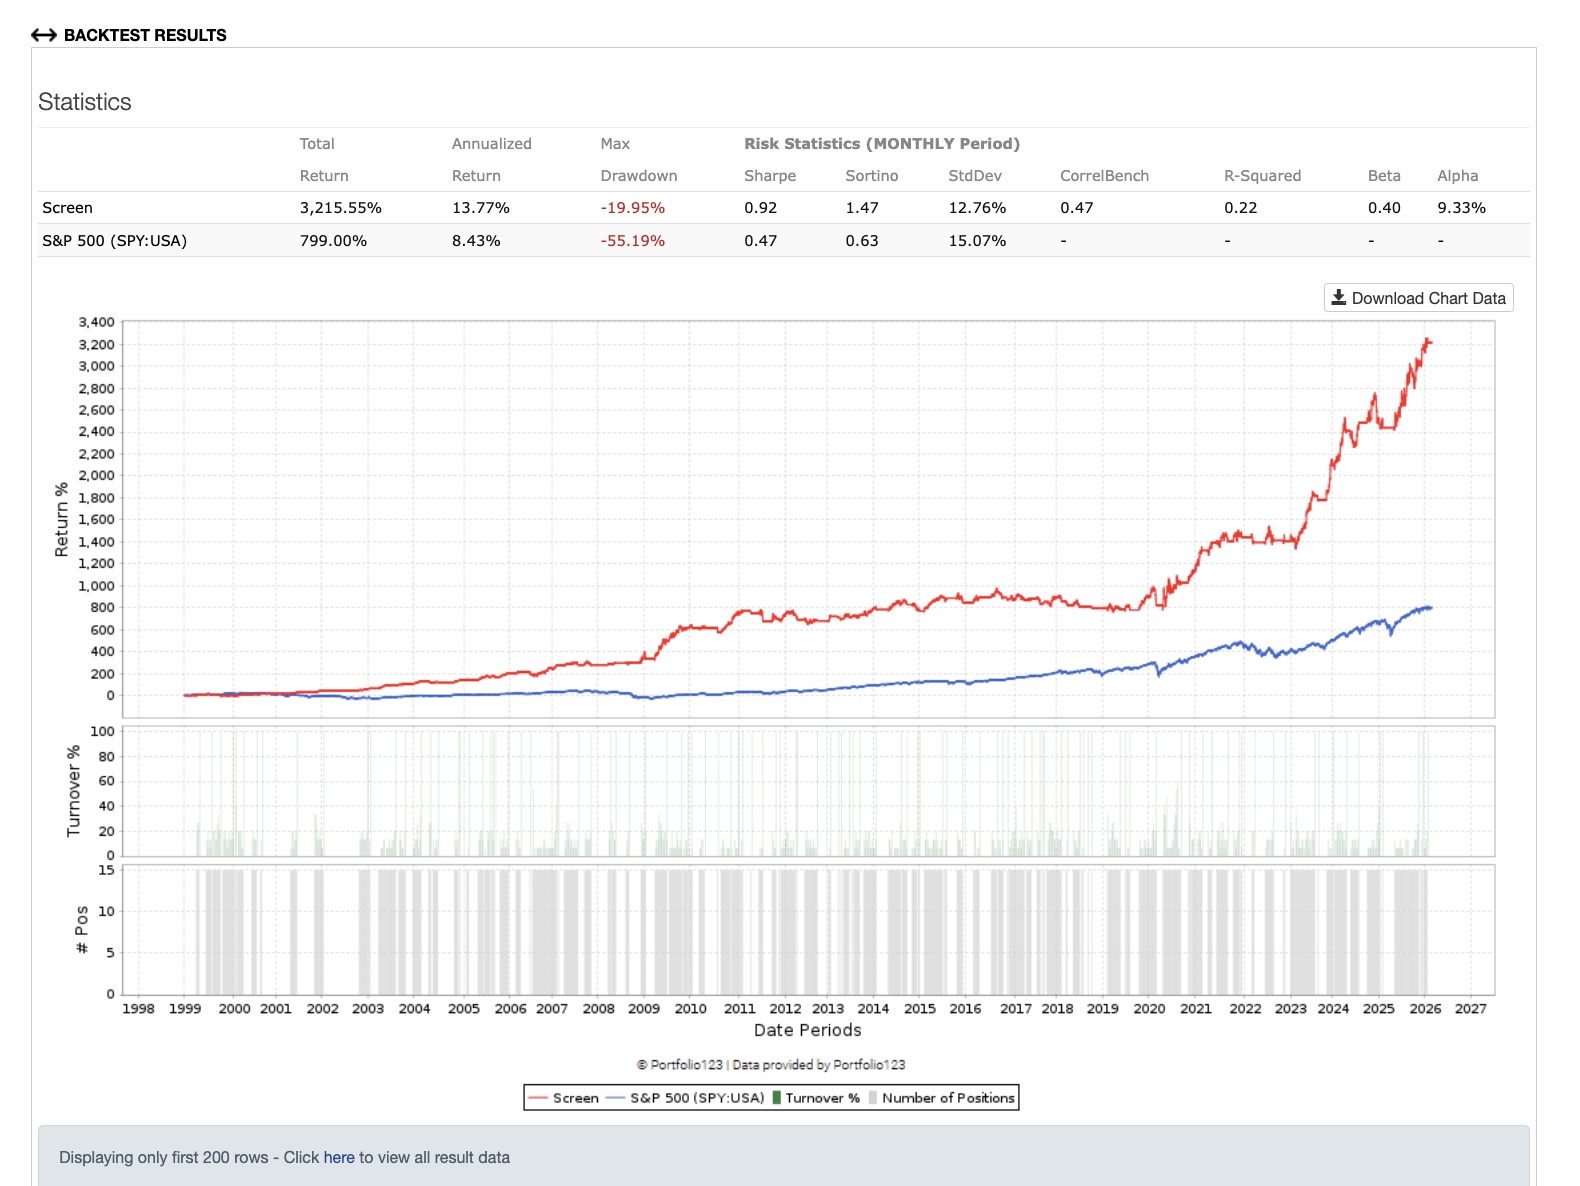
You can see the portfolios feature a less severe maximum drawdown and a drastically lower standard deviation than the models without the risk overlay. While still out performing the SP500 and showing both an improvement in the Sortino ratio and Sharpe ratio.
Learn more about the portfolios