
Lutey Growth 'CAN SLIM' Tactical Technical Risk Overlay - Risk Preservation
Preserve risk while maintaining return. Minimize the risk exposure to underlying market movements by deinvesting capital following a weekly applied risk overlay.
Portfolio Process
The portfolios follow an investing style that involves first selecting the passing stocks each week that follow either the Lutey Growth (or Lutey Value) stock screens. These screens follow the investing style of CAN SLIM (Lutey Growth) or Warren Buffet (Lutey Value). The passing stocks are held for the week and then updated the next week.
When the Capital Weighted Volume 'CWV' Tactical Risk Overlay ticks on it signals more bearish power than bullish power in the market. Meaning more capital is moving out of the SP500 than in it and it might be time to de-invest in the portfolios. This process is carried out by first measuring the value of the 'CWV' indicator before applying the screen rules to the portfolios.
The screen rules and indicator breakdown for a daily rebalance is shown in the 2025 Journal of Investing Publication below. This signifies the historical validity and statistical significance of the study while maintaining a practical update to real time investing shown in the two images above with passing recommended stocks updated weekly.
The paper breaks down the summary of risk and return historically including the Sharpe Ratio, Sortino Ratio, Standard Deviation, Maximum Drawdown, Total Return and Average Annualized Return. This describes the tactical overlay tool used and the portfolio rebalancing process.
Take me to the Tactical Risk Overlay Growth and Value 2025 Publication
Preserve Risk while maintaining return - applying a tactical risk overlay - Lutey Growth 'CAM SLIM'
A tactical risk overlay called 'Capital Weighted Volume' (CWV) maintains the historical return on the model while lowering the risk. See the case study image to the right applying the Lutey Growth - CAN SLIM model in real time with the Capital Weighted Volume Indicator over the last year.
The historicall total return shows that the standard deviation is in the moderate growth or value area when compared to the SP500 while boasting growth returns. This portfolio shows a Sortino Ratio of 1.49 compared to the SP500 of 0.63. This is a great improvement on the risk-adjusted return of the market when considering the downside only deviation periods.
Take me to the weekly CWV Risk Overlay - Lutey Growth CAN SLIM model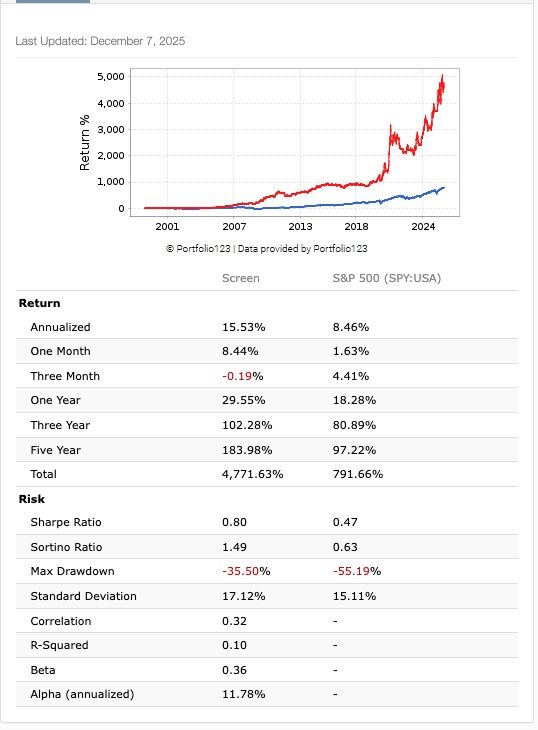
Preserve Risk while maintaining return - applying a tactical risk overlay - 'Lutey Value' Buffet
A tactical risk overlay called 'Capital Weighted Volume' (CWV) maintains the historical return on the model while lowering the risk. See the case study image to the right applying the Lutey Value - Warren Buffet model in real time with the Capital Weighted Volume Indicator over the last year.
The historical total return shows that the standard deviation is in the moderate growth or value area when compared to the SP500 while boasting growth returns. This portfolio shows a Sortino Ratio of 1.49 compared to the SP500 of 0.63. This is a great improvement on the risk-adjusted return of the market when considering the downside only deviation periods.
Take me to the weekly CWV Risk Overlay - Lutey Value Buffet model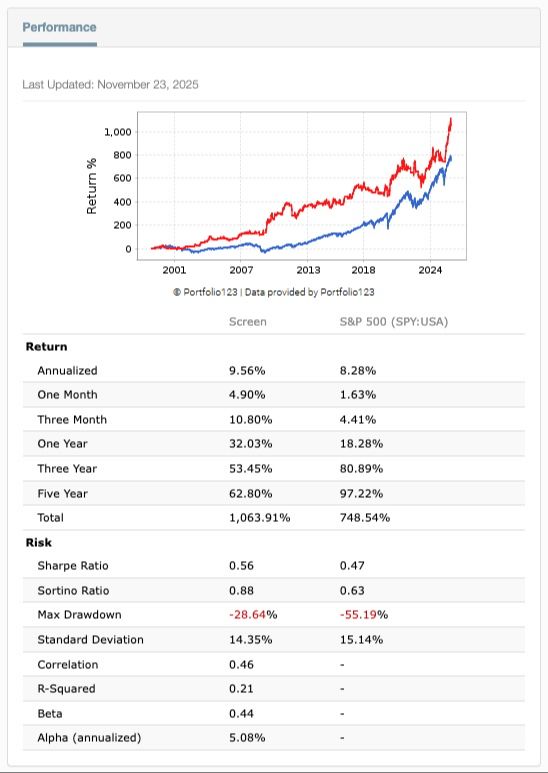
Notable reading:
Other papers of interest that are cited from Lutey (2025) (above) for better understanding Capital Weighted Volume Better, and the Lutey 'Growth' and Lutey 'Value' famous investor portfolios are in the references. They are:
- This shows that adding the VPCI indicator to the Lutey and Mukherjee (2023) Famous Investor Portfolios improves the returns by an average of 300% on both the NYSE/NASDAQ 'All U.S. Stock' holdings and SP500.
Lutey and Mukherjee (2023) - Towards a Simplified CAN SLIM Model
- This compared the CAN SLIM model from prior works of Lutey, Hassan and Rayome (2018) and Lutey, Crum and Rayome (2013-2014) which study the CAN SLIM system stand alone on each of the Dow Jones, Nasdaq (2014) and SP500 (2013) to the other famous 'guru' investors including Warren Buffet, Benjamin Graham and find that the CAN SLIM model outperforms the other famous 'guru' investors.
Lutey (2022) - Accumulated Capital Weighted and Volume Volume Price Indicator Factor Model
- This discusses the creation of both the Volume Price Confirmation Indicator and Capital Weighted Volume signals from Buff Dormeier (2011). This shows the equation and indicator breakdown and results of buying stocks that pass a combined factor model in the NYSE/Nasdaq cross-section of U.S. stocks.
.
