All The Tools You Need To Build A Successful Investing Portfolio with 10 stock picks monthly.
The below investment strategy is from published research in the Asian Journal of Economic Modeling (Lutey et. al 2018).
Automated CAN SLIM Investing Newsletter
For portfolio positions jump to the offer below. For most recent rebalance items jump to the members area (in the offer).
The goal is to follow The CAN SLIM system (as out lined in Lutey, et al. 2018). The system involves ranking stocks based on factors of earnings per share (EPS) and sales growth over the most recent quarter and a 3 year average on the Dow Jones Industrial Average stocks.
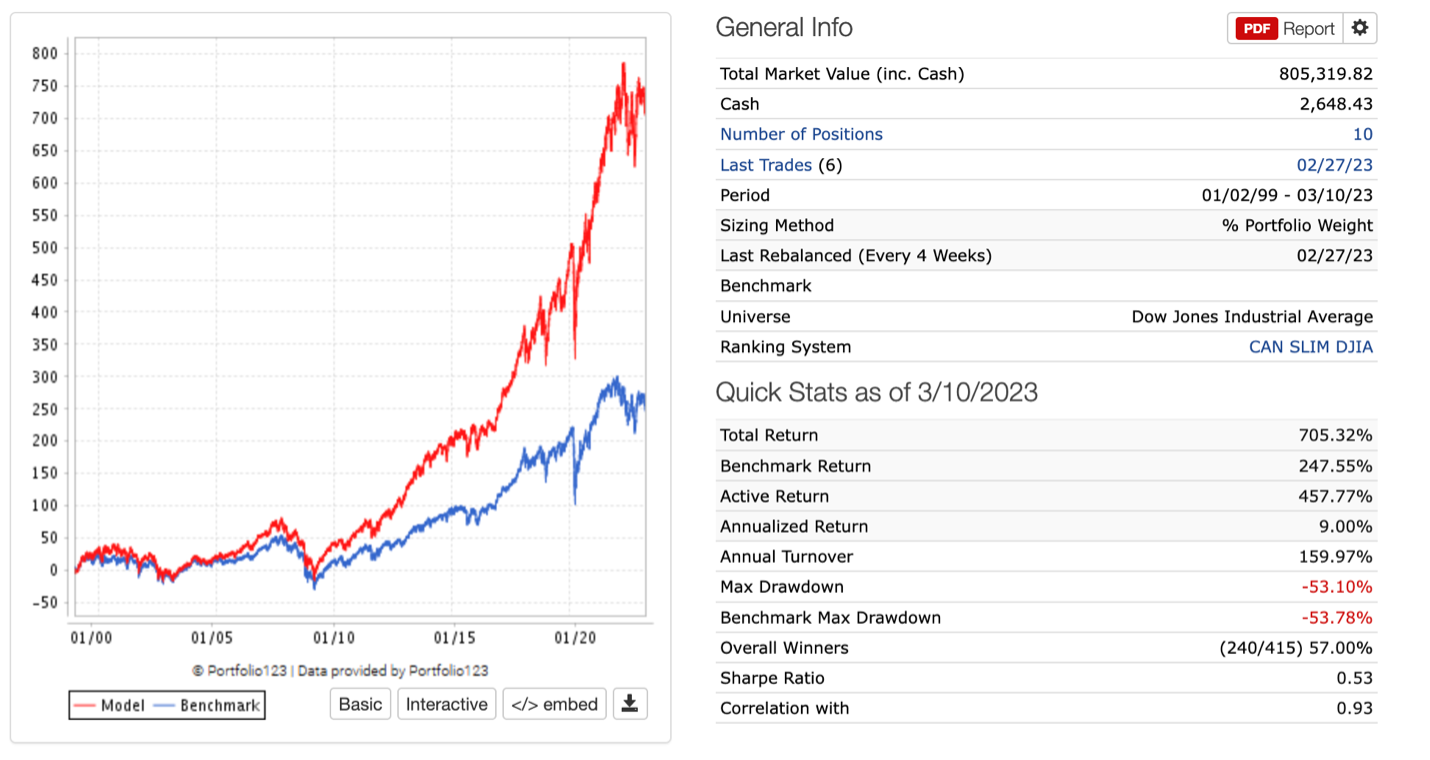
Historically the system performs well. The results are published from 1999-2015 in the Asian Journal of Economic Modeling and the full paper is available on my google.com/scholar.
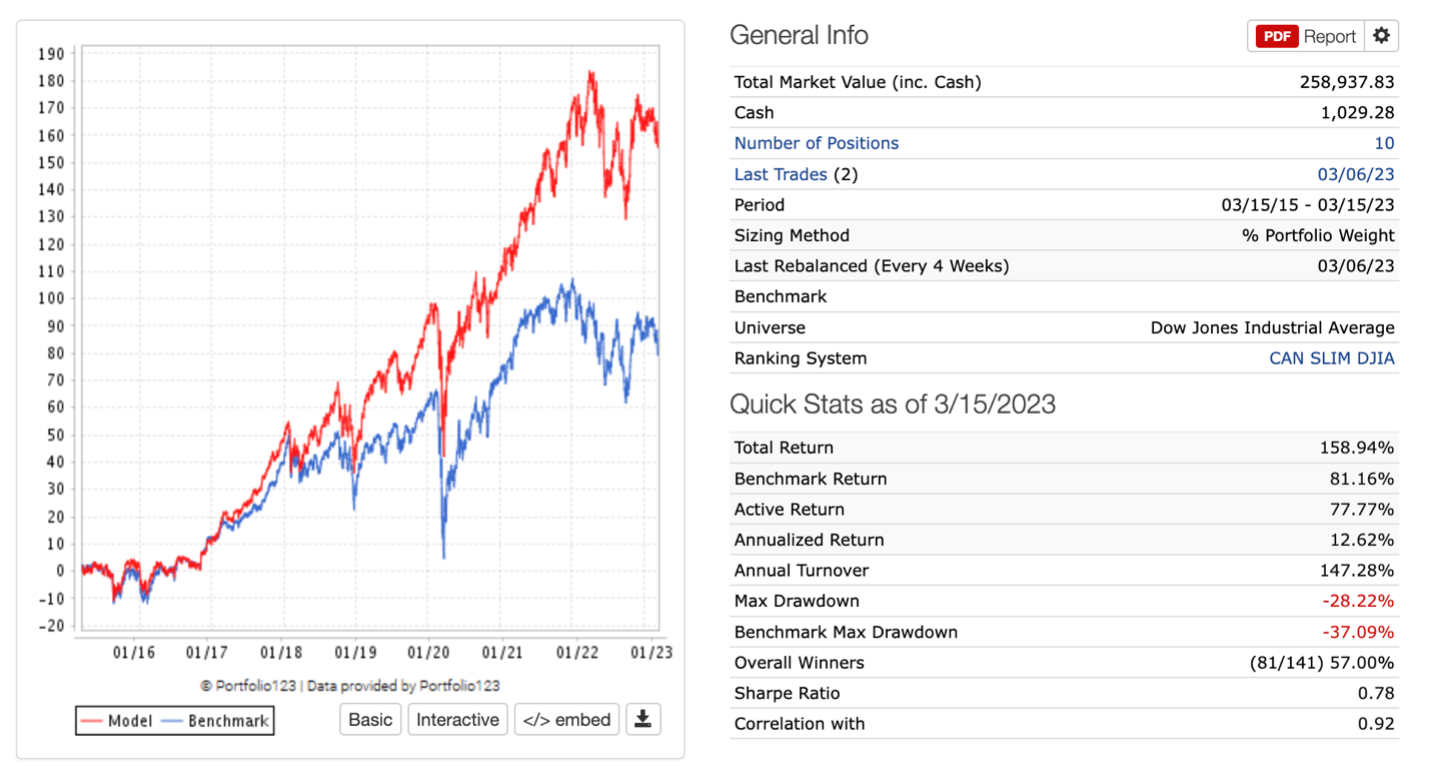
Extending the sample beyond the published date of 2015 perform well. See below.
2015-Present based on a $100,000 initial investment.
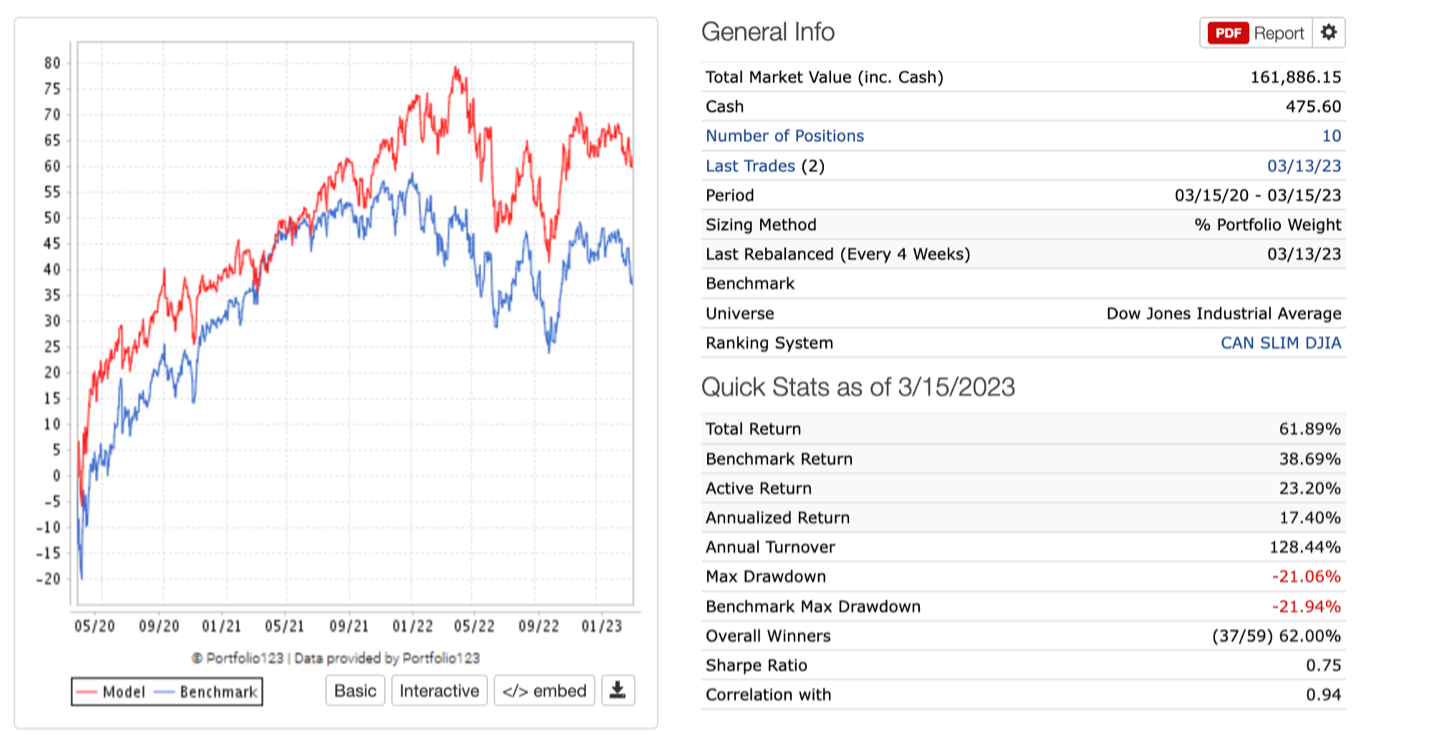
Last 3 years based on a $100,000 initial investment.
Holding the top ten stocks on the dow following a can slim ranking system that outperforms the market from 1999-2023. The system shows promising results until 2015 (in sample) and out of sample until 2023. The in sample results are published in the Asian Journal of Economic Modeling (Lutey et al (2018)).
Each period we select the top ten stocks based on their rank following the below methodology. The stocks are ranked based on where they stand on each factor out of 100. Then each factor is weighted by the weight given to it in the table. The result is then a rank for that stock based on the factors and weights provided. For this system it is growth. When a stock drops below 60 it is removed from the system and the next best available stock is added while keeping a target allocation of 10% per stock.
The purpose of the system is to rank stocks based on the following criteria.
|
Model |
Definition |
Weight |
Code |
|
CAN SLIM DJIA |
|
|
|
|
Earnings Per Share(EPS) |
EPS Excluding Extraordinary Items is earnings per share, including all-expense except those deemed extraordinary. Growth is compared to the same quarter one year prior. . |
35% weight (stocks in the Dow Jones), 15% weight (stocks in the same industry) |
EPSExclXorGr%PYQ |
|
Three-year EPS growth |
Growth=Earnings Per Share value taken straight out of the SEC filing with the most recent three-year values. The 3-year value is the average growth over the last three years. |
15% weight (stocks in the Dow Jones), 20% weight (stocks within the same industry) |
EPSExclXorGr%3Y |
|
Sales |
Sales is total revenues realized by a company in a period of time. Data comes from the SEC filings. Data is examined in relation to the same quarter one year prior. |
10% (stocks within the same industry) |
SalesGr%PYQ |
|
Three-Year Sales growth |
Growth=Sales value taken straight out of the SEC filing with the most recent three-year values. The 3-year value is the average growth over the last three years. |
5% (stocks within the same industry) |
Sales3YCGr% |
The above strategy is followed in real time with real money based on a $10,000 investment. Account weights for $100,000 and $1,000,000 are shown inside.